 Global| Sep 28 2006
US GDP Growth Revised Back to 2.6%, Profits Weaker
by:Tom Moeller
|in:Economy in Brief
Summary
U.S. real GDP growth last quarter was revised back to 2.6% (AR) from the preliminary report of 2.9% and the advance report of 2.5% growth. The figure fell short of Consensus expectations for an unrevised 2.9% advance. Growth in 2Q [...]
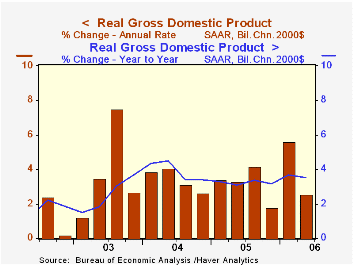
U.S. real GDP growth last quarter was revised back to 2.6% (AR) from the preliminary report of 2.9% and the advance report of 2.5% growth. The figure fell short of Consensus expectations for an unrevised 2.9% advance.
Growth in 2Q corporate profits was revised down to 1.4% (18.5% y/y) from the initial report of a 3.2% advance. Profits at U.S. nonfinancial corporations fell a revised 3.6% (+10.7% y/y) instead of rising 0.6%. Financial corporate profits grew a stronger 9.4% (29.6% y/y) and earnings of overseas corporations grew a stronger 6.1% (29.5% y/y).A lessened contribution from inventories, back to 0.4% from 0.6%, was the source of most of the downward revision to 2Q GDP growth. The contribution from an improved net export deficit was unrevised at 0.4 percentage points though exports grew a somewhat stronger 6.2% (8.2% y/y) and imports rose 1.4% (6.4% y/y).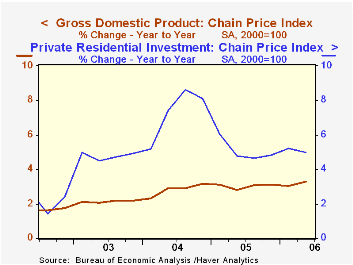
Growth in final sales to domestic purchasers was notched down slightly to 1.6% (3.0% y/y) as the decline in residential investment was deepened to 11.1% (-1.5% y/y) and that reduced 2Q GDP growth by 0.7 percentage points.
Real personal consumption expenditures was unrevised at 2.6% (3.0% y/y) while growth in business fixed investment was revised slightly lower to 4.4% (7.2% y/y).
The rise in the GDP chain price index was unrevised at 3.3%. Less final sales of computers the chain price index grew 3.5% (3.4% y/y). The chain price index for residential investment grew 2.9% (5.0% y/y), down from a peak quarterly rate of growth of 10.5% in early 2004.
Barreling Down the Road To Recession? from the Federal Reserve Bank of St. Louis can be found here.
| Chained 2000$, % AR | 2Q '06 (Final) | 2Q '06 (Prelim.) | 1Q '06 | Y/Y | 2005 | 2004 | 2003 |
|---|---|---|---|---|---|---|---|
| GDP | 2.6% | 2.9% | 5.6% | 3.5% | 3.2% | 3.9% | 2.5% |
| Inventory Effect | 0.4% | 0.6% | -0.0% | 0.6% | -0.3% | 0.4% | 0.0% |
| Final Sales | 2.1% | 2.3% | 5.6% | 2.9% | 3.5% | 3.5% | 2.5% |
| Foreign Trade Effect | 0.4% | 0.4% | -0.0% | -0.1% | -0.1% | -0.5% | -0.3% |
| Domestic Final Demand | 1.6% | 1.7% | 5.4% | 3.0% | 3.6% | 4.0% | 2.8% |
| Chained GDP Price Index | 3.3% | 3.3% | 3.3% | 3.3% | 3.0% | 2.8% | 2.1% |
by Tom Moeller September 28, 2006
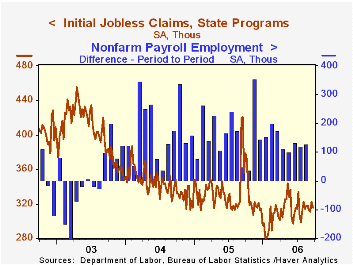
Initial claims for jobless insurance fell 6,000 to 316,000 after an upwardly revised 11,000 increase during the prior week. Consensus expectations had been for 315,000 claims.
During the last ten years there has been a (negative) 78% correlation between the level of initial claims and the m/m change in nonfarm payroll employment.
The four-week moving average of initial claims fell slightly to 315,500 (-16.9% y/y). 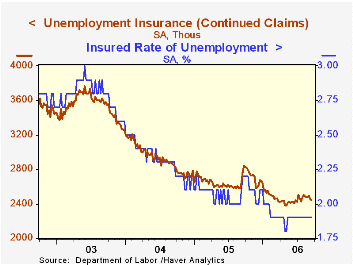
Continuing claims for unemployment insurance fell 8,000 after a 38,000 drop the prior week that was deeper than initially reported.
The insured rate of unemployment was steady at 1.9% where it has been since February.
| Unemployment Insurance (000s) | 9/23/06 | 9/16/06 | Y/Y | 2005 | 2004 | 2003 |
|---|---|---|---|---|---|---|
| Initial Claims | 316 | 322 | -11.2% | 332 | 343 | 403 |
| Continuing Claims | -- | 2,444 | -12.0% | 2,662 | 2,924 | 3,532 |
by Carol Stone September 28, 2006
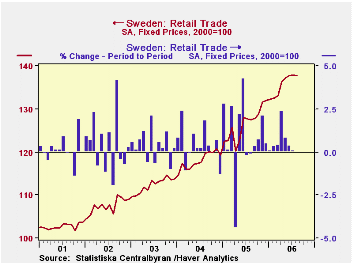
Retail trade in Sweden was flat from month-to-month over this past summer, but Swedish consumers have shown some interesting underlying buying patterns. Total retail sales edged down 0.1% in August following a similar minuscule increase in July. The index was 137.8, seasonally adjusted, in August on a 2000 base, with not seasonally adjusted results up 8.3% from a year ago.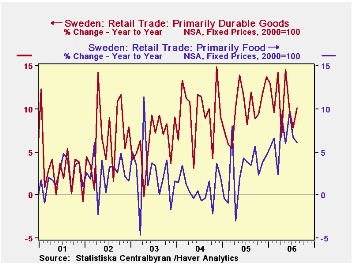
Conventional consumer necessities, food and clothing, show moderate growth, with food in August up 6.1% on the year-ago, but down 1.7% from July. Sales of those stores have grown at about a 3% annual rate since the middle of 2000. Apparel, released with a month's lag, fell in July by 0.8% after a 2.3% decline in June. Apparel sales have been erratic, with, for instance, these two downs following ups of 7.7% in April and 1.0% in May. All together, since last August, clothing store sales have risen 3.3% at an annual rate (compared with August, the same year-ago period used with all other items here).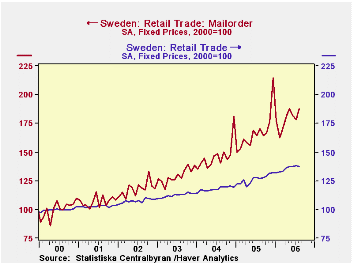
Durable good spending, by contrast, has been strong in Sweden. It can also take a seesaw pattern, but 12-month growth rates have fluctuated in a range around 10% since April 2005, indicating quite lively demand for these items.
The feature of these retail trade data that caught our eye this morning is the strength of "non-store" retailing, especially mail order. The total retail trade index for August is 137.8 on a base of 2000=100. The non-store sector stands at 184.2 and the mail-order segment of that is at 187.6. These represent six-year growth rates of about 10% from the 2000 base. As we all know, the same phenomenon has gripped US shoppers: total retail sales converted to a 2000 base would stand at roughly 140, while "electronic shopping and mail order houses" would be just below 160. So Swedes have gone even more vigorously into this mode of buying. Cold winters may be one reason: a quick calculation of implied seasonal factors shows that mail order purchases have a high seasonal in the winter and are sluggish in the spring, compared with their total retail sales, which have the opposite pattern of mid-winter sloth but a spring revival. Shopping from home is a definite plus when it's cold outside.
| Sweden: SA*, Fixed 2000 Prices |
Aug 2006 | July 2006 | June 2006 | Aug 2005 | 2005 | 2004 | 2003 |
|---|---|---|---|---|---|---|---|
| Total**, 2000= 100 | 137.8 | 137.9 | 137.8 | 127.5 | 126.4 | 118.0 | 112.4 |
| % Change | -0.1 | 0.1 | 0.4 | 8.3 | 6.9 | 5.5 | 4.4 |
| Primarily Food | -1.7 | 0.6 | 1.3 | 6.1 | 2.9 | 0.9 | 2.4 |
| Apparel | -- | -0.8 | -2.3 | 3.3*** | 6.8 | 7.6 | 3.1 |
| Primarily Durable Goods | 1.4 | -0.6 | -0.3 | 10.1 | 10.1 | 9.5 | 6.3 |
| Mail Order | 5.2 | -1.8 | -3.2 | 9.9 | 14.2 | 13.2 | 9.1 |

Tom Moeller
AuthorMore in Author Profile »Prior to joining Haver Analytics in 2000, Mr. Moeller worked as the Economist at Chancellor Capital Management from 1985 to 1999. There, he developed comprehensive economic forecasts and interpreted economic data for equity and fixed income portfolio managers. Also at Chancellor, Mr. Moeller worked as an equity analyst and was responsible for researching and rating companies in the economically sensitive automobile and housing industries for investment in Chancellor’s equity portfolio. Prior to joining Chancellor, Mr. Moeller was an Economist at Citibank from 1979 to 1984. He also analyzed pricing behavior in the metals industry for the Council on Wage and Price Stability in Washington, D.C. In 1999, Mr. Moeller received the award for most accurate forecast from the Forecasters' Club of New York. From 1990 to 1992 he was President of the New York Association for Business Economists. Mr. Moeller earned an M.B.A. in Finance from Fordham University, where he graduated in 1987. He holds a Bachelor of Arts in Economics from George Washington University.
More Economy in Brief


