Global| Aug 31 2005
US GDP Growth Little Revised, Profits Quite Firm
by:Tom Moeller
|in:Economy in Brief
Summary
2Q05 US real GDP growth was little revised at 3.3% (AR) as revisions to foreign trade and inventories roughly offset one another. Consensus expectations had been for 3.4% growth. Operating corporate profits rose a firm 6.1% (17.7%) [...]
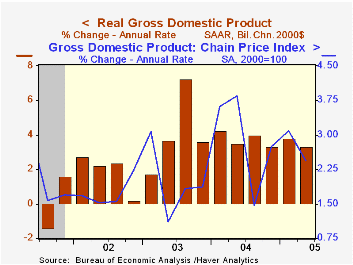
2Q05 US real GDP growth was little revised at 3.3% (AR) as revisions to foreign trade and inventories roughly offset one another. Consensus expectations had been for 3.4% growth.
Operating corporate profits rose a firm 6.1% (17.7%) following a 5.6% gain during 1Q. The increase came despite a 2.2% decline (+9.1% y/y) in financial sector earnings and a modest 1.1% increase (10.6% y/y) increase in foreign earnings. US nonfinancial corporate sector earnings rose 11.9% (24.1% y/y), the strongest quarterly increase in three years.
The positive contribution to GDP growth from a shallower foreign trade deficit was lessened to 1.2 percentage points as import growth was revised to show a slight q/q increase rather than a 2.0% decline. Export growth was raised slightly to 13.2% (8.3% y/y).
The negative growth contribution from inventories was lessened and offset the trade revision, but the 2.0 percentage point drag still was the third in the last four quarters and was the largest since 2000. 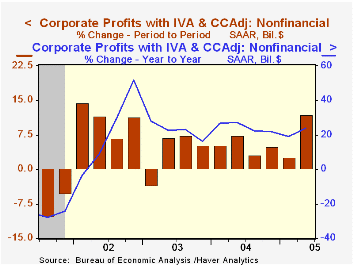
Growth in domestic demand was reduced to 3.9%. Business fixed investment growth was notched down a bit to 8.4% (AR, 9.1% y/y) from 9.0% and growth in real PCE similarly was lowered to 3.0% (3.8% y/y) from 3.3%. Residential building growth of 9.8% (5.8% y/y) was unrevised.
The chain price index was unrevised at 2.4% and the chain price index for domestic final demand was lowered slightly to 3.1% (2.8% y/y).
The minutes to the latest meeting of the FOMC can be found here.
| Chained 2000$, % AR | 2Q '05 (Prelim.) | 2Q '05 (Advance) | 1Q '05 | Y/Y | 2004 | 2003 | 2002 |
|---|---|---|---|---|---|---|---|
| GDP | 3.3% | 3.4% | 3.8% | 3.6% | 4.2% | 2.7% | 1.6% |
| Inventory Effect | -2.0% | -2.3% | 0.3% | -1.4% | 0.3% | 0.0% | 0.4% |
| Final Sales | 5.4% | 5.8% | 3.5% | 4.2% | 3.9% | 2.7% | 1.2% |
| Foreign Trade Effect | 1.2% | 1.6% | -0.4% | 0.1% | -0.5% | -0.3% | -0.6% |
| Domestic Final Demand | 3.9% | 4.0% | 3.7% | 4.1% | 4.4% | 3.0% | 1.8% |
| Chained GDP Price Index | 2.4% | 2.4% | 3.1% | 2.4% | 2.6% | 2.0% | 1.7% |
by Tom Moeller August 31, 2005
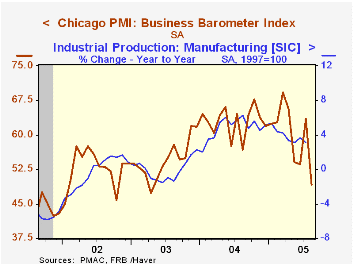
The August Chicago Purchasing Managers Business Barometer reversed all of the prior month's sharp gain with a 14.3 point m/m drop to 49.2 that dropped the index to its lowest in over two years. Consensus expectations had been for just a slight decline 61.0.
During the last ten years there has been a 65% correlation between the level of Chicago PMI and the three month change in factory sector industrial production.
New orders cratered 23.1 points and the production index dropped 14.4 points. Employment fell a lesser 4.4 points to 51.7. During the last ten years there has been a 75% correlation between the level of the employment index and the three month change in factory sector employment.
The index of prices repeated the 1.6 rise in July and rose to its highest level since April. During the last ten years there has been an 86% correlation between the Chicago price index and the three month change in the "core" intermediate goods PPI.
| Chicago Purchasing Managers Index, SA | Aug | July | Aug '04 | 2004 | 2003 | 2002 |
|---|---|---|---|---|---|---|
| Business Barometer | 49.2 | 63.5 | 56.8 | 62.9 | 54.6 | 52.8 |
| New Orders | 46.5 | 69.6 | 58.2 | 67.0 | 58.0 | 56.2 |
| Prices Paid | 62.9 | 61.3 | 86.6 | 80.1 | 55.8 | 56.9 |
by Tom Moeller August 31, 2005
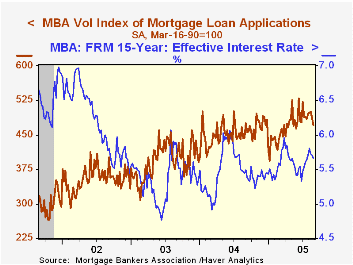
The total number of mortgage applications fell 4.5% last week and continued the recent decline which has pulled applications 18.5% below the recent peak in early June, according to the Mortgage Bankers Association.
Purchase applications fell 3.6% on the heels of a 2.2% decline the week prior. The average level in August is off 1.3% from July. During the last ten years there has been a 49% correlation between the y/y change in purchase applications and the change in new plus existing single family home sales.
Mortgage applications to refinance fell a hard 5.4% w/w and are down 10.6% in August versus July.
The effective interest rate on a conventional 30-year mortgage backpedaled further to 5.98% from 6.02% the prior week. The effective rate on a 15-year mortgage also fell to 5.66%.
The Mortgage Bankers Association surveys between 20 to 35 of the top lenders in the U.S. housing industry to derive its refinance, purchase and market indexes. The weekly survey accounts for more than 40% of all applications processed each week by mortgage lenders. Visit the Mortgage Bankers Association site here.
| MBA Mortgage Applications (3/16/90=100) | 08/26/05 | 08/19/05 | Y/Y | 2004 | 2003 | 2002 |
|---|---|---|---|---|---|---|
| Total Market Index | 722.5 | 756.2 | 12.4% | 735.1 | 1,067.9 | 799.7 |
| Purchase | 470.6 | 488.4 | 6.2% | 454.5 | 395.1 | 354.7 |
| Refinancing | 2,187.8 | 2,313.9 | 21.3% | 2,366.8 | 4,981.8 | 3,388.0 |

Tom Moeller
AuthorMore in Author Profile »Prior to joining Haver Analytics in 2000, Mr. Moeller worked as the Economist at Chancellor Capital Management from 1985 to 1999. There, he developed comprehensive economic forecasts and interpreted economic data for equity and fixed income portfolio managers. Also at Chancellor, Mr. Moeller worked as an equity analyst and was responsible for researching and rating companies in the economically sensitive automobile and housing industries for investment in Chancellor’s equity portfolio. Prior to joining Chancellor, Mr. Moeller was an Economist at Citibank from 1979 to 1984. He also analyzed pricing behavior in the metals industry for the Council on Wage and Price Stability in Washington, D.C. In 1999, Mr. Moeller received the award for most accurate forecast from the Forecasters' Club of New York. From 1990 to 1992 he was President of the New York Association for Business Economists. Mr. Moeller earned an M.B.A. in Finance from Fordham University, where he graduated in 1987. He holds a Bachelor of Arts in Economics from George Washington University.
More Economy in Brief