 Global| Sep 19 2006
US Flow of Funds: Households' Net Worth Stable
by:Tom Moeller
|in:Economy in Brief
Summary
The net worth of the US household sector inched up just 0.1% last quarter versus 1Q'06 to $53.3 trillion. The gain totaled, however, 7.9% versus the second quarter of last year. On the asset side of the ledger, total assets of [...]
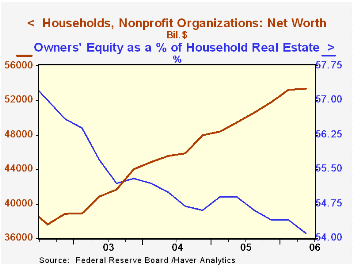
The net worth of the US household sector inched up just 0.1% last quarter versus 1Q'06 to $53.3 trillion. The gain totaled, however, 7.9% versus the second quarter of last year.
On the asset side of the ledger, total assets of households and nonprofit organizations rose 8.4% y/y. Households' ownership of real estate rose 10.5% in value to over $20 trillion. Mutual fund share holdings rose 18.0% though the value of corporate equities held directly by households fell 1.5%. The value of money market shares rose 14.6% after a 6.0% gain last year and Treasury security holdings rose 20.6% y/y in value after a 2.2% decline during 2005.
Credit market debt outstanding held by all sectors of the economy grew 8.9%, about steady with last year's pace. The federal government's debt grew 5.9% y/y but U.S. households increased their borrowing at nearly twice that rate, 11.0%. Home mortgage liabilities grew 12.6% y/y after 14% gains during the prior three years. Consumer credit increased 3.9% y/y, the same as last year's growth rate, but households' obligations in the form of bank loans more than doubled versus 2Q of last year and also doubled during all of 2005.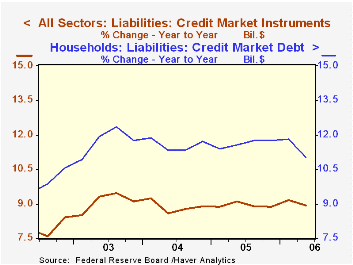
Borrowing by nonfinancial corporations continued strong, up 11.9%, following double digit growth during 2004 & 2005. During the last forty years there has been a 40% correlation between the y/y growth in corporate borrowing and the growth in nonresidential fixed investment.
Foreign sector holdings of US assets continued to surge, by 13.3% y/y. That was stable with last year's growth rate but it raised foreigners' ownership of U.S. credit outstanding to 14.1% versus 10.0% ten years ago.
Intangible Capital and Economic Growth from the Federal Reserve Board is available here.
| Flow of Funds (Y/Y Chg.) | % of Total | 2Q'06 | 1Q'06 | 2005 | 2004 | 2003 |
|---|---|---|---|---|---|---|
| Total Credit Market Debt Outstanding | 8.9% | 9.2% | 8.9% | 8.9% | 9.1% | |
| Federal Government | 12% | 5.9% | 6.5% | 7.0% | 9.0% | 10.9% |
| Households | 27% | 11.0% | 11.8% | 11.7% | 11.7% | 11.8% |
| Nonfinancial Corporate Business | 14% | 6.8% | 6.1% | 5.5% | 3.6% | 2.2% |
| Financial Sectors | 32% | 9.1% | 8.9% | 8.2% | 8.1% | 9.9% |
| Net Worth: Households & Nonprofit Organizations (Trillions) | $53.3 | $53.3 | $51.8 | $48.0 | $44.0 | |
| Tangible Assets: Households | $26.3 | $25.8 | $25.2 | $22.5 | $20.4 | |
| Financial Assets: Households | $39.8 | $39.9 | $38.8 | $36.4 | $33.5 |

Tom Moeller
AuthorMore in Author Profile »Prior to joining Haver Analytics in 2000, Mr. Moeller worked as the Economist at Chancellor Capital Management from 1985 to 1999. There, he developed comprehensive economic forecasts and interpreted economic data for equity and fixed income portfolio managers. Also at Chancellor, Mr. Moeller worked as an equity analyst and was responsible for researching and rating companies in the economically sensitive automobile and housing industries for investment in Chancellor’s equity portfolio. Prior to joining Chancellor, Mr. Moeller was an Economist at Citibank from 1979 to 1984. He also analyzed pricing behavior in the metals industry for the Council on Wage and Price Stability in Washington, D.C. In 1999, Mr. Moeller received the award for most accurate forecast from the Forecasters' Club of New York. From 1990 to 1992 he was President of the New York Association for Business Economists. Mr. Moeller earned an M.B.A. in Finance from Fordham University, where he graduated in 1987. He holds a Bachelor of Arts in Economics from George Washington University.
More Economy in Brief


