 Global| Oct 28 2005
US 3Q GDP Grew 3.8%
by:Tom Moeller
|in:Economy in Brief
Summary
US real GDP grew 3.8% (AR) last quarter and slightly beat Consensus expectations for 3.6% growth. That strength versus 3.3% growth during 2Q '05 came despite an unspecified subtraction (perhaps 0.2 percentage points) due to Hurricanes [...]
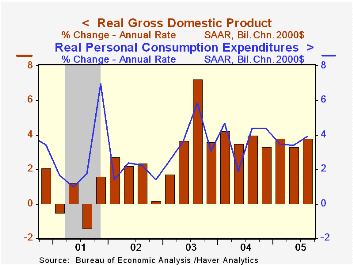
Domestic demand growth remained firm at 4.1% due to 3.9% (3.8% y/y) growth in real PCE which was powered by a 17.6% (4.6% y/y) jump in motor vehicle purchases. Spending on furniture & household appliances also jumped 12.1% (9.0% y/y) and services spending rose 3.2%. (3.0% y/y).
Investment spending remained strong. Business fixed investment rose 6.2% (7.8% y/y) due to an 8.9% (10.1% y/y) gain in equipment & software. Structures spending fell 1.4% (+1.0% y/y). Residential investment continued higher yet the 4.8% (6.6% y/y) increase lagged the 10.8% growth during 2Q.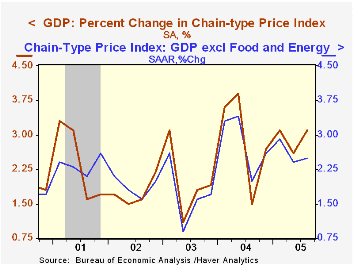
Inventory accumulation continued to have a negative effect on GDP growth. The 0.6 percentage point subtraction was lower than during 2Q but it was the fourth subtraction in the last five quarters.
A shallower foreign trade deficit added marginally to GDP growth following the 1.1 percentage point add during 2Q. Exports continued higher although the 0.7% (6.5% y/y) rise was well off the pace of the prior two years during which quarterly export growth averaged 7.7%.Imports fell slightly (+4.5% y/y) for the second consecutive quarter.
The chain price index rose 3.1%, elevated from 2Q due to the surge in energy prices. Less food & energy the GDP chain price index rose 2.5%, the same as during the prior two years. The chain price index for domestic final demand rose 4.0% after an elevated 3.3% gain in 2Q yet less food & energy the 2.2% gain was a hair below the 2.5% averaged during the prior two years.
| Chained 2000$, % AR | 3Q '05 (Advance) | 2Q '05 | Y/Y | 2004 | 2003 | 2002 |
|---|---|---|---|---|---|---|
| GDP | 3.8% | 3.3% | 3.6% | 4.2% | 2.7% | 1.6% |
| Inventory Effect | -0.6% | -2.1% | -0.6% | 0.3% | 0.0% | 0.4% |
| Final Sales | 4.4% | 5.6% | 4.2% | 3.9% | 2.7% | 1.2% |
| Foreign Trade Effect | 0.1% | 1.1% | 0.2% | -0.5% | -0.3% | -0.6% |
| Domestic Final Demand | 4.1% | 4.2% | 4.0% | 4.4% | 3.0% | 1.8% |
| Chained GDP Price Index | 3.1% | 2.6% | 2.9% | 2.6% | 2.0% | 1.7% |

Tom Moeller
AuthorMore in Author Profile »Prior to joining Haver Analytics in 2000, Mr. Moeller worked as the Economist at Chancellor Capital Management from 1985 to 1999. There, he developed comprehensive economic forecasts and interpreted economic data for equity and fixed income portfolio managers. Also at Chancellor, Mr. Moeller worked as an equity analyst and was responsible for researching and rating companies in the economically sensitive automobile and housing industries for investment in Chancellor’s equity portfolio. Prior to joining Chancellor, Mr. Moeller was an Economist at Citibank from 1979 to 1984. He also analyzed pricing behavior in the metals industry for the Council on Wage and Price Stability in Washington, D.C. In 1999, Mr. Moeller received the award for most accurate forecast from the Forecasters' Club of New York. From 1990 to 1992 he was President of the New York Association for Business Economists. Mr. Moeller earned an M.B.A. in Finance from Fordham University, where he graduated in 1987. He holds a Bachelor of Arts in Economics from George Washington University.
More Economy in Brief


