 Global| Oct 06 2006
Upward Revision Salvages Weak September U.S. Payroll Report
by:Tom Moeller
|in:Economy in Brief
Summary
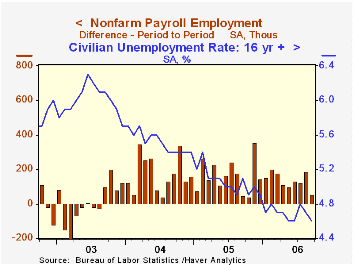
Nonfarm payrolls last month rose just 51,000. The gain fell well below Consensus expectations for a 121,000 rise and the increase was the slowest since last October, when Hurricane Katrina hit the jobs figures. Salvaging the dim [...]

Nonfarm payrolls last month rose just 51,000. The gain fell well below Consensus expectations for a 121,000 rise and the increase was the slowest since last October, when Hurricane Katrina hit the jobs figures.
Salvaging the dim report was an upward revision to August's gain to 188,000 from 128,000, reported initially. That left the three month average increase in jobs at 121,000, down just modestly from the nine month average of 137,000. Nevertheless, the recent increases are below an average monthly gain of 165,000 last year and an average 175,000 during 2004.
From the household survey the unemployment rate fell again to 4.6%, a level recently hit in May & June. Employment rose 271,000 (1.7% y/y) after a 250,000 increase during August. The labor force increased 101,000 (1.1% y/y) and the labor force participation rate held for the fourth month at 66.2%.
Suggestive of moderation in hiring activity, the breadth of one month gain in private payrolls fell to 51.4% in September from 55.6% in August. The three month diffusion index also fell to 53.2%, the lowest level in nearly one year. In the factory sector the one month breadth of gain fell further below break even to 40.5% from 43.5% in August. The three month diffusion index fell to 36.9%, also it's lowest in nearly a year.
Factory sector payrolls dropped 19,000 for the sixth m/m decline this year. Job declines in machinery (+2.4% y/y), electrical equipment (+3.0% y/y), furniture (-3.2% y/y), primary metals (0.3% y/y) and nondurables (-0.9% y/y) were offset by m/m increases in the motor vehicle & parts industries (-2.3% y/y) and computers & electronics (+0.6 y/y).
Private service-producing jobs rose just 62,000 (1.3%) after an August gain that was taken up to 170,000 from 101,000 reported last month. Financial sector jobs were firm and rose 16,000 (2.1% y/y) while professional & business services employment rose 12,000 (2.4% y/y). Temporary help services jobs fell 11,300 (0.7% y/y) and retail trade sector jobs continued weak, falling another 11,900 (-0.5% y/y). Government sector jobs fell 8,000 (+0.6% y/y).
Construction employment increased 8,000 (2.9% y/y) after a 23,000 gain during August.
Average hourly earnings rose the same 0.2% as during an upwardly revised August but fell short of expectations for a 0.3% rise. Factory sector earnings fell 0.1% (+1.3% y/y).
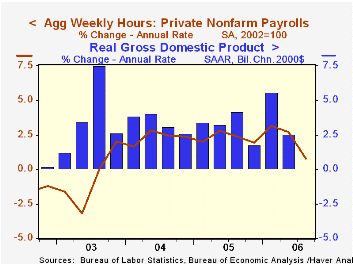
The workweek was stable m/m but the index of aggregate weekly hours worked in private industries fell 0.1% for the second month. During 3Q the average level of the index rose 0.9% (AR) after a 2.6% gain during 2Q. During the last ten years there has been an 81% correlation between the y/y change in aggregate hours worked and real GDP growth.
The Price Puzzle: An Update and a Lesson from the Federal Reserve Bank of St. Louis can be found here.
| Employment | September | August | Y/Y | 2005 | 2004 | 2003 |
|---|---|---|---|---|---|---|
| Payroll Employment | 51,000 | 188,000 | 1.3% | 1.5% | 1.1% | -0.3% |
| Manufacturing | -19,000 | -7,000 | 0.2% | -0.6% | -1.3% | -4.9% |
| Average Weekly Hours | 33.8 | 33.8 | 33.8 (Sept. '05) | 33.8 | 33.7 | 33.7 |
| Average Hourly Earnings | 0.2% | 0.2% | 4.0% | 2.8% | 2.1% | 2.7% |
| Unemployment Rate | 4.6% | 4.7% | 5.1% (Sept. '05) | 5.1% | 5.5% | 6.0% |
by Carol Stone October 6, 2006

Three Central and Eastern European nations reported September CPI data today. There are hints throughout of easing inflation pressures, although these performances remain uneven.
In Estonia, the CPI, seasonally adjusted by Haver Analytics, actually fell in the month, by 0.3%. This followed at 1.1% increase in August and helped pull the year-on-year rate from 5.0% in August to 3.8% for September. Transportation and recreation were the main contributors to the softening. 
Slovenia's CPI rose 0.3%, but this was notably less than August's 1.5% advance. The weaker September result pulled the year/year pace down to 2.5%, after stronger figures in four of the previous five months. Here too, transportation contributed to the slowing.
In the Ukraine, inflation remains strong and accelerated through last year, when it was up 13.5% on average over 2004's level. In September, the CPI was up 2.2%, hardly a slower pace at 29.2% annualized, but the year-on-year rates have come down considerably from last year's amounts. The Ukraine experiences wide swings in individual CPI categories, so identifying major forces on the total is an indeterminate process. This country, however, is the one among these three that did not see fuel prices ease in September. They were still going up.
In Estonia and Slovenia, transportation costs declined outright; this included falling motor fuel prices in Slovenia and we assume also in Estonia. In Slovenia, which reports more detail (in the form of the EU's HICP array), airfares also fell. As oil prices begin to drop, we note that such declines benefit every energy-consuming country. We see already how this helps in these two small nations, which are among the earliest to publish their September CPI data. A week ago, Eurostat published its "flash" estimate for the entire EuroZone, and at 1.8% year-on-year, it indicated a notable slowing from prior months, which have been well over 2%.
| Consumer Price Indexes | Sept 2006 | Aug 2006 | 2005* | 2004* | 2003* |
|---|---|---|---|---|---|
| Estonia, SA, 1997=100 | 146.2 | 146.6 | 138.4 | 133.0 | 129.0 |
| Mo/Mo | -0.3 | 1.1 | |||
| Yr/Yr* | 3.8 | 5.0 | 4.1 | 3.0 | 1.3 |
| Slovenia, SA, 2005=100 | 103.8 | 103.5 | 100.0 | 97.6 | 94.2 |
| Mo/Mo | 0.3 | 1.5 | |||
| Yr/Yr* | 2.5 | 3.3 | 2.5 | 3.6 | 5.6 |
| Ukraine, SA, 2005= 100 | 112.4 | 110.0 | 100.0 | 88.1 | 80.8 |
| Mo/Mo | 2.2 | 1.3 | |||
| Yr/Yr* | 9.1 | 7.4 | 13.5 | 9.0 | 5.2 |
Tom Moeller
AuthorMore in Author Profile »Prior to joining Haver Analytics in 2000, Mr. Moeller worked as the Economist at Chancellor Capital Management from 1985 to 1999. There, he developed comprehensive economic forecasts and interpreted economic data for equity and fixed income portfolio managers. Also at Chancellor, Mr. Moeller worked as an equity analyst and was responsible for researching and rating companies in the economically sensitive automobile and housing industries for investment in Chancellor’s equity portfolio. Prior to joining Chancellor, Mr. Moeller was an Economist at Citibank from 1979 to 1984. He also analyzed pricing behavior in the metals industry for the Council on Wage and Price Stability in Washington, D.C. In 1999, Mr. Moeller received the award for most accurate forecast from the Forecasters' Club of New York. From 1990 to 1992 he was President of the New York Association for Business Economists. Mr. Moeller earned an M.B.A. in Finance from Fordham University, where he graduated in 1987. He holds a Bachelor of Arts in Economics from George Washington University.
More Economy in Brief
 Global| Feb 05 2026
Charts of the Week: Balanced Policy, Resilient Data and AI Narratives
by:Andrew Cates


