 Global| Sep 29 2005
Unemployment Insurance Claims Fell Sharply
by:Tom Moeller
|in:Economy in Brief
Summary
Initial claims for unemployment insurance fell a sharp 79,000 to 356,000 last week following a 11,000 rise the prior week which was little revised. Consensus expectations had been that claims would remain in a range of 350,000 to [...]
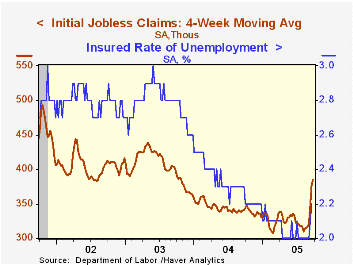
Initial claims for unemployment insurance fell a sharp 79,000 to 356,000 last week following a 11,000 rise the prior week which was little revised. Consensus expectations had been that claims would remain in a range of 350,000 to 500,000, wide due to uncertainty caused by Hurricanes.
The Labor Department indicated that, seasonally unadjusted, initial claims linked to Hurricane Katrina totaled 60,000, down from 108,000 the prior week. No claims were yet linked to Hurricane Rita.
The four-week moving average of initial claims rose to 385.500 (13.0% y/y) from 377,000 during the prior four weeks.
Continuing claims for unemployment insurance surged 144,000 following a slightly revised 80,000 increase during the prior week.
The insured rate of unemployment rose to 2.2% from 2.1% the week prior.
| Unemployment Insurance (000s) | 09/24/05 | 09/17/05 | Y/Y | 2004 | 2003 | 2002 |
|---|---|---|---|---|---|---|
| Initial Claims | 356 | 435 | 0.0% | 343 | 402 | 404 |
| Continuing Claims | -- | 2,802 | -1.7% | 2,926 | 3,531 | 3,570 |
by Tom Moeller September 29, 2005
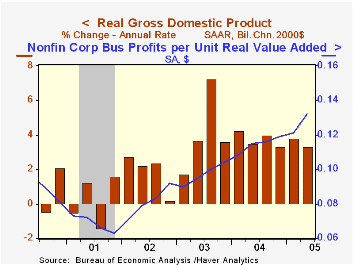
The "final" estimate of US real GDP growth during 2Q was unrevised at 3.3% (AR) and matched Consensus expectations. Downward revisions to foreign trade and inventories were offset by an upward revision to domestic demand growth.
The upward revision to domestic demand growth stemmed from business fixed investment growth to 8.8% from 8.4% (AR, 9.2% y/y) and growth in real PCE which was raised to 3.9% from 3.0% (3.9% y/y). Residential building growth also was raised to 10.8% from 9.8% (6.1% y/y).
Growth in operating corporate profits was reduced to 4.6% from 6.1% (16.0%) following a 5.6% gain during 1Q. Growth in US nonfinancial corporate sector earnings was lowered slightly to 11.5% from 11.9% (23.7% y/y), still the strongest quarterly increase in three years.Profit margin expansion last quarter was the greatest on record.
The positive contribution to GDP growth from a shallower foreign trade deficit was lessened to 1.1 percentage points. Import growth was reduced back to an estimated slight q/q decline (+5.7% y/y) but growth in exports was lowered more to 10.7% from 13.2% (AR, 7.7% y/y).
The negative growth contribution from inventory decumulation was lessened slightly and still was the third in the last four quarters and was the largest since 2000.
The chain price index was revised up to 2.6% as the chain price index for domestic final demand was raised to 3.3% (2.8% y/y).
Why Has Output Become Less Volatile? from the Federal Reserve Bank of San Francisco is available here.
| Chained 2000$, % AR | 2Q '05 (Final) | 2Q '05 (Prelim.) | 1Q '05 | Y/Y | 2004 | 2003 | 2002 |
|---|---|---|---|---|---|---|---|
| GDP | 3.3% | 3.3% | 3.8% | 3.6% | 4.2% | 2.7% | 1.6% |
| Inventory Effect | -2.1% | -2.0% | 0.3% | -1.4% | 0.3% | 0.0% | 0.4% |
| Final Sales | 5.6% | 5.4% | 3.5% | 4.2% | 3.9% | 2.7% | 1.2% |
| Foreign Trade Effect | 1.1% | 1.2% | -0.4% | 0.1% | -0.5% | -0.3% | -0.6% |
| Domestic Final Demand | 4.2% | 3.9% | 3.7% | 4.1% | 4.4% | 3.0% | 1.8% |
| Chained GDP Price Index | 2.6% | 2.4% | 3.1% | 2.5% | 2.6% | 2.0% | 1.7% |
by Tom Moeller September 29, 2005
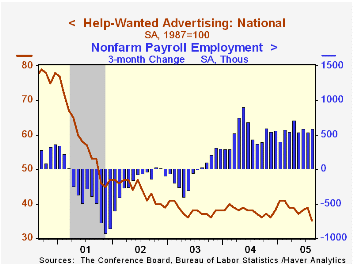
The Index of Help-Wanted Advertising from the Conference Board fell sharply in August to 35 from 39 in July, a record low.
During the last ten years there has been a 61% correlation between the level of help-wanted advertising and the three month change in non-farm payrolls.
The proportion of labor markets with rising want-ad volume collapsed to 20% from 71% in July and was less than the level averaged last year.
The Conference Board surveys help-wanted advertising volume in 51 major newspapers across the country every month.
The latest help wanted report from the Conference Board is available here.
| Conference Board | Aug | July | Aug '04 |
|---|---|---|---|
| National Help Wanted Index | 35 | 39 | 37 |
by Carol Stone September 29, 2005
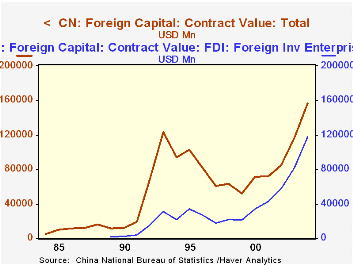
Further data were reported today on foreign direct investment in China for 2004. These data covered the total value of foreign investment contracts, including direct investment and "others", which covers leasing and other types of financing. The grand total of foreign investment contracts was $156.6 billion, 34% more than in 2003. A special vehicle, "foreign investment enterprises", is the main Chinese counterparty in these transactions. The data for these began in 1989 with $1.7 billion in committed inflows; last year they brought in $117.3 billion. The more familiar "joint venture" ownership vehicle, a partnership between a Chinese and a foreign firm, accounted for $27.6 billion in 2004.
These figures come from contracts for new projects. The flows of actual funding, so-called "capital utilized" are lower as the projects are actually accomplished. In 2004, the total amount of capital utilized was $64.1 billion, up from $56.1 billion in 2003. 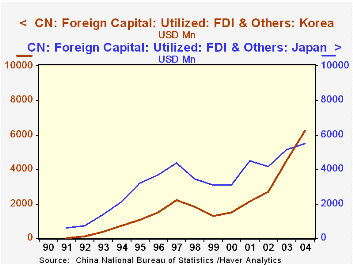
As we examined these data, the geographic origins of these funds and ownership interests drew our attention. Hong Kong entities are by far the largest providers of foreign capital for China, with $20.8 billion last year, about 32% of capital utilized. Other Asian interests are well represented, including Japan with $5.5 billion and Korea, $6.3 billion. Notably, last year was the first in which Korean inflows were larger than those from Japan. Western investors were less involved (though perhaps some Hong Kong capital represents a flow-through of Western money). German investors, for instance, have averaged just about $1 billion in Chinese FDI annually in recent years, and the UK, about $800 million. Nine major European countries together invested $3.8 billion last year, compared with $3.9 billion for the US. As seen in the table below, US funding has actually declined recently; it had been $5.4 billion in 2002.
General interest in China is growing, of course. Separate figures on the value of contracts year-to-date show that new contracts for standard FDI projects (excluding the "other" financing categories) are up in the first half of this year by 19% from the first half of 2004. At the same time, this is slower than 30%-40% growth of the prior couple of years. And the flow of capital utilized was actually a bit smaller in the first half of this year than last. In part, this reflects normal volatility in what are by nature uneven, "lumpy" flows. Even so, the impression of a continuously mushrooming volume of outside funding going into China is not quite an accurate one.
| Billions of US$ | 2005 | 2004 | 2003 | 2002 | 2001 |
|---|---|---|---|---|---|
| Total Foreign Capital: Value of Contracts |
156.6 | 116.9 | 84.8 | 72.0 | 71.1 |
| Foreign Capital Utilized | 64.1 | 56.1 | 55.0 | 49.7 | 59.4 |
| Capital Utilized from Hong Kong | 20.8 | 19.5 | 17.9 | 17.9 | 16.7 |
| Japan | 5.5 | 5.1 | 4.2 | 4.5 | 3.1 |
| Korea | 6.3 | 4.5 | 2.7 | 2.2 | 1.5 |
| Germany | 1.1 | 0.9 | 0.9 | 1.2 | 1.0 |
| U.S. | 3.9 | 4.4 | 5.4 | 4.5 | 4.4 |

Tom Moeller
AuthorMore in Author Profile »Prior to joining Haver Analytics in 2000, Mr. Moeller worked as the Economist at Chancellor Capital Management from 1985 to 1999. There, he developed comprehensive economic forecasts and interpreted economic data for equity and fixed income portfolio managers. Also at Chancellor, Mr. Moeller worked as an equity analyst and was responsible for researching and rating companies in the economically sensitive automobile and housing industries for investment in Chancellor’s equity portfolio. Prior to joining Chancellor, Mr. Moeller was an Economist at Citibank from 1979 to 1984. He also analyzed pricing behavior in the metals industry for the Council on Wage and Price Stability in Washington, D.C. In 1999, Mr. Moeller received the award for most accurate forecast from the Forecasters' Club of New York. From 1990 to 1992 he was President of the New York Association for Business Economists. Mr. Moeller earned an M.B.A. in Finance from Fordham University, where he graduated in 1987. He holds a Bachelor of Arts in Economics from George Washington University.
More Economy in Brief


