 Global| Jul 28 2008
UK Real Estate Agents ReportDeclines In House Prices And More Difficulties In Making A Sale
Summary
The United Kingdom's Hometrack Survey reports local market information compiled by real estate agents around England and Wales. The agents report on house prices, the ratio of the sales price to the asking price, the number of weeks [...]

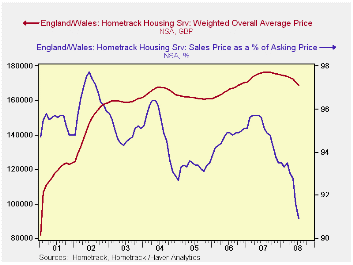
The United Kingdom's Hometrack Survey reports local market information compiled by real estate agents around England and Wales. The agents report on house prices, the ratio of the sales price to the asking price, the number of weeks it takes to make a sale and the average number of viewings per sale.
According to the July report, released today, the weighted
average price of a house fell 1.2% from 170,500 GBP (Great Britain
Pound) in June to 168,500 GBP in July. (In U. S. dollars, $335,000).
The average price of a house is now 4.4% below the peak reached a year
ago. The selling price of a house has also declined relative to its
asking price. In July, the ratio of sales price to asking price was
90.9, down from 91.6 in June and well below the recent high of 95.7
reached in May, 2007. The average price of a house and the ratio of the
sales price to the asking price are shown in the first chart.
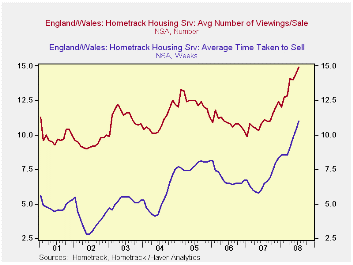
Indicative of the difficulty of selling houses, the real estate agents reported that it took 11 weeks to complete a sale in July, 2008 compared with 10.3 in June and 90% higher than the 5.8 weeks in May, 2007. The number of viewings before a sale was made was 14.9 in July up from 14.4 in June and 51% higher than the 9.9 in January, 2007. The number of weeks it takes to make a sale and the number of viewings before a sale is made are shown in the second chart.
| United Kingdom | Jul 08 | Jun 08 | Previous High or Low | Date | M/M chg | Chg from Previous High or Low | 2007 | 2006 |
|---|---|---|---|---|---|---|---|---|
| House Price (GBP) | 168500 | 170500 | 176300 | Aug 07 | -1.2% | -4.4% | 174867 | 165725 |
| Ratio Sales Price to Asking Price | 90.9 | 91.6 | 65.7 | May 07 | -0.7 | -4.8 | 95.0 | 94.7 |
| Number of Weeks before a Sale | 11.0 | 10.3 | 5.8 | May 07 | 6.8% | 89.7% | 6.7 | 6.8 |
| Number of Viewings before a Sale | 14.9 | 14.4 | 9.9 | Jan 07 | 3.5% | 50.5% | 11.0 | 10.9 |
by Robert Brusca July 28, 2008

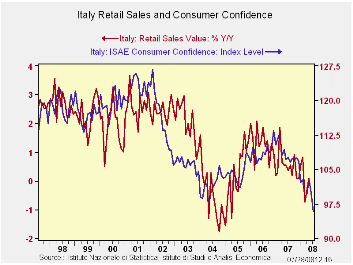
Italy’s retail sector is in a bad way. Consumer sentiment ad
retail spending usually mark one another pretty well. Right now both
series are telling a dismal story about the Italian consumer. The
recent drop-of in spending is severe, with most of the drop coming in
March and with no recovery (small real declines) in April and May.
In the quarter-to-date Italy’s real retail spending is
dropping at a 4.1% annual rate. This is in keeping with other signs
from the Euro Area that weakness has suddenly intensified. Even so the
Germany ministry is today saying that they are not going to change
their GDP outlook. There is a thin line that separates stoicism from
denial. The Euro Area seems to be sinking deeper into an undesired
economic funk. Meanwhile the ECB still sees inflation as public enemy
number-one. Only in the EMU’s UK do the monetary authorities seem to
have a grip on the true dual risk of their situation. Still they have
not magic policy plan but are marking time to see which risk blows out
of proportion and will need attention first.
| Italy Retail Sales Growth | ||||||||
|---|---|---|---|---|---|---|---|---|
| mo/mo % | At annual rates | |||||||
| Nominal | May-08 | Apr-08 | Mar-08 | 3-Mo | 6-Mo | 12-Mo | Yr Ago | Q-2-Date |
| Retail Trade | 0.2% | 0.1% | -0.6% | -1.5% | 0.0% | 0.1% | 0.6% | -0.7% |
| Food Beverage & Tobacco | 0.3% | 0.1% | -0.5% | -0.7% | 1.0% | 1.1% | 1.0% | 0.2% |
| Clothing & Furniture | 4.8% | -4.1% | -2.8% | -9.1% | -0.2% | -0.2% | 0.1% | -14.5% |
| Total Real Retail | -0.2% | -0.1% | -1.1% | -5.4% | -3.9% | -3.4% | -1.0% | -4.1% |


