 Global| Oct 30 2025
Charts of the Week: Optimism with Caveats
by:Andrew Cates
|in:Economy in Brief
Summary
Global equity markets are once again flirting with record highs, buoyed by renewed optimism that the global economy can achieve a soft landing—and by persistent enthusiasm over the potential productivity gains from AI-related investment. The Federal Reserve’s decision to cut rates by 25bps this week—its second this autumn—initially reinforced expectations that global monetary policy is shifting toward a more accommodative stance. However, Chair Powell’s reminder that a further cut in December was “not inevitable” tempered that optimism and was met with some disappointment in financial markets (chart 1). Even so, the broader tone remains constructive, though it contrasts with a still-fragile macro environment. Renewed conflict in Gaza, the ongoing US government shutdown, and intensifying trade tensions have kept risk sentiment uneven and underscored the fragility of the recovery. The latest flash PMIs (chart 2) show modest global expansion led by services, while manufacturing continues to struggle. Consumer confidence (chart 3) tells a similar story: sentiment has weakened in the US as the labour market softens, stabilised in the euro area, and improved slightly in the UK. In the euro area, sluggish money and credit growth (chart 4) and the ECB’s latest bank-lending survey confirm that financial conditions remain mildly restrictive despite recent rate cuts. The UK CBI Industrial Trends Survey (chart 5) points to manufacturers reducing inventories and deferring investment plans amid demand uncertainty. Externally, the Drewry Container Index (chart 6) has fallen back from 2024’s elevated levels, signalling easing supply-chain pressures and subdued traded-goods inflation—though tariff realignments remain a potential source of friction.
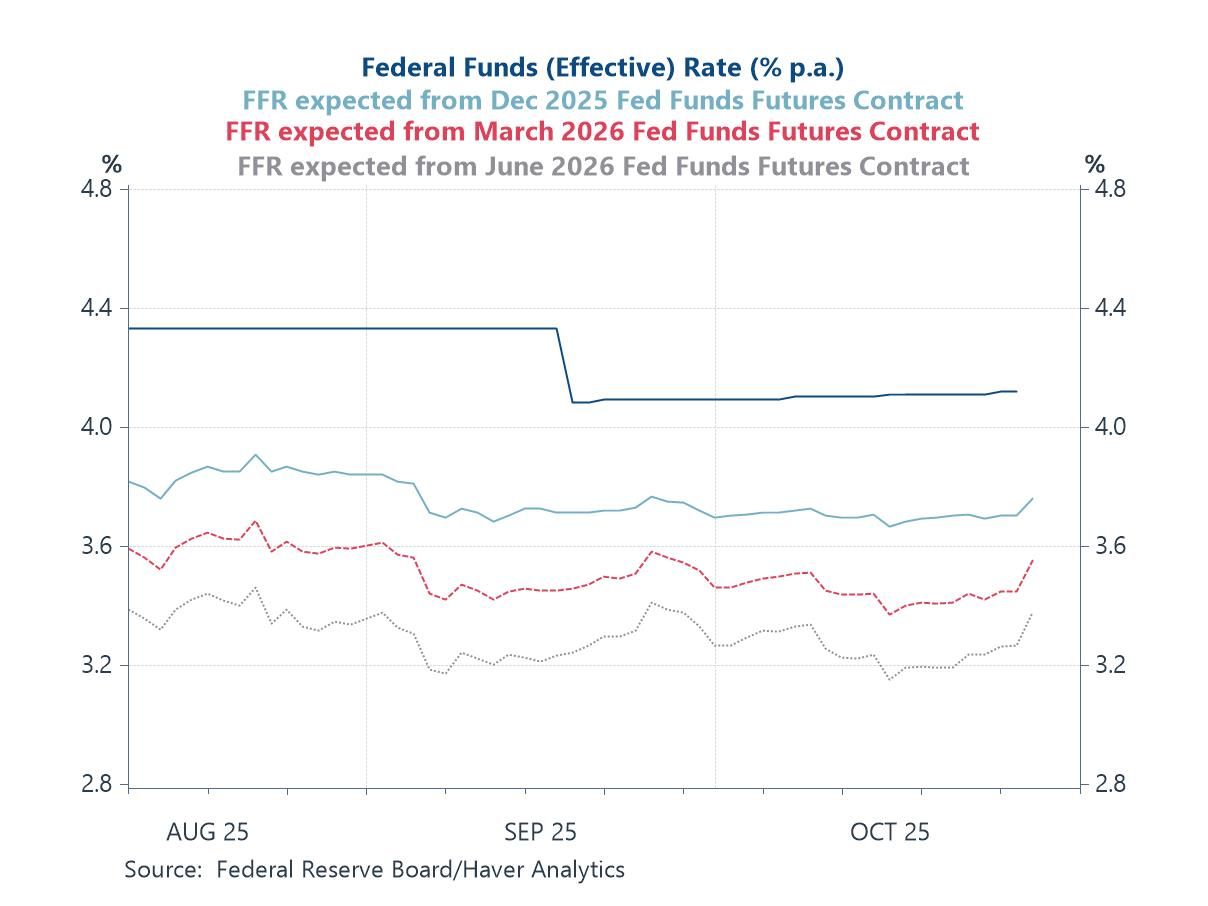
US monetary policy This first chart shows that Chair Powell’s cautious tone in the aftermath of this week’s FOMC meeting led markets to scale back expectations for further near-term easing. Fed funds futures for late 2025 through mid-2026 rose slightly, signalling that investors now expect a shallower and slower easing cycle than before. While the rate cut itself confirmed the Fed’s gradual pivot toward easier policy, markets interpreted Powell’s remarks as suggesting that a December move is not guaranteed and that the central bank remains wary of declaring victory on inflation too soon.
Chart 1: Implied interest rates from US Fed Funds futures contracts
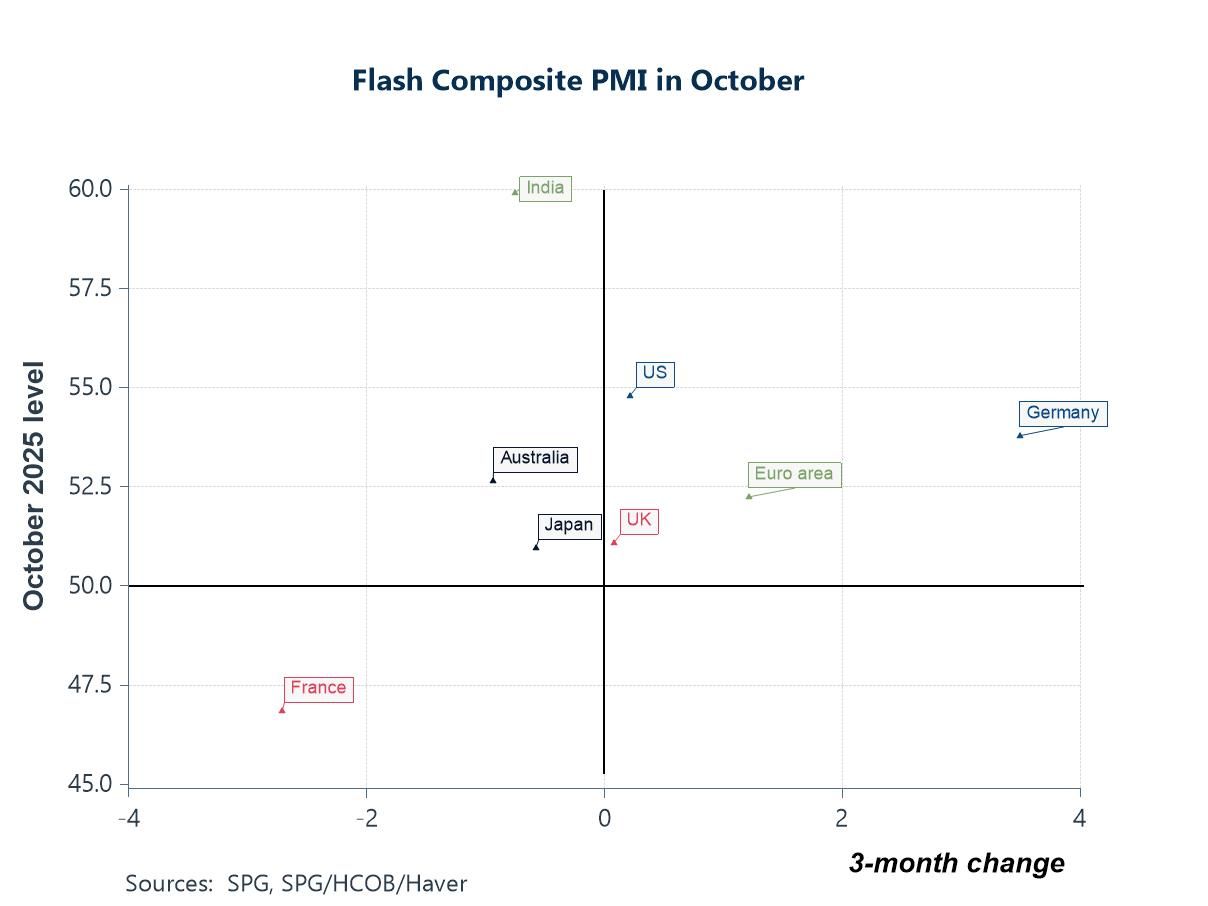
The global business cycle The latest flash PMI surveys for October highlight a still-divergent global picture, with services-led resilience offsetting persistent manufacturing weakness. Activity remains strongest in India and the United States, both comfortably in expansion territory, while Germany has shown one of the clearest signs of improvement within the euro area after a long period of contraction. The broader euro area and UK readings point to modest but positive momentum, suggesting that growth is stabilising rather than accelerating. In contrast, France remains mired below the 50 threshold, signalling continued contraction, and Japan and Australia are treading water with only marginal gains.
Chart 2: Flash PMI surveys for October 2025: Levels versus changes
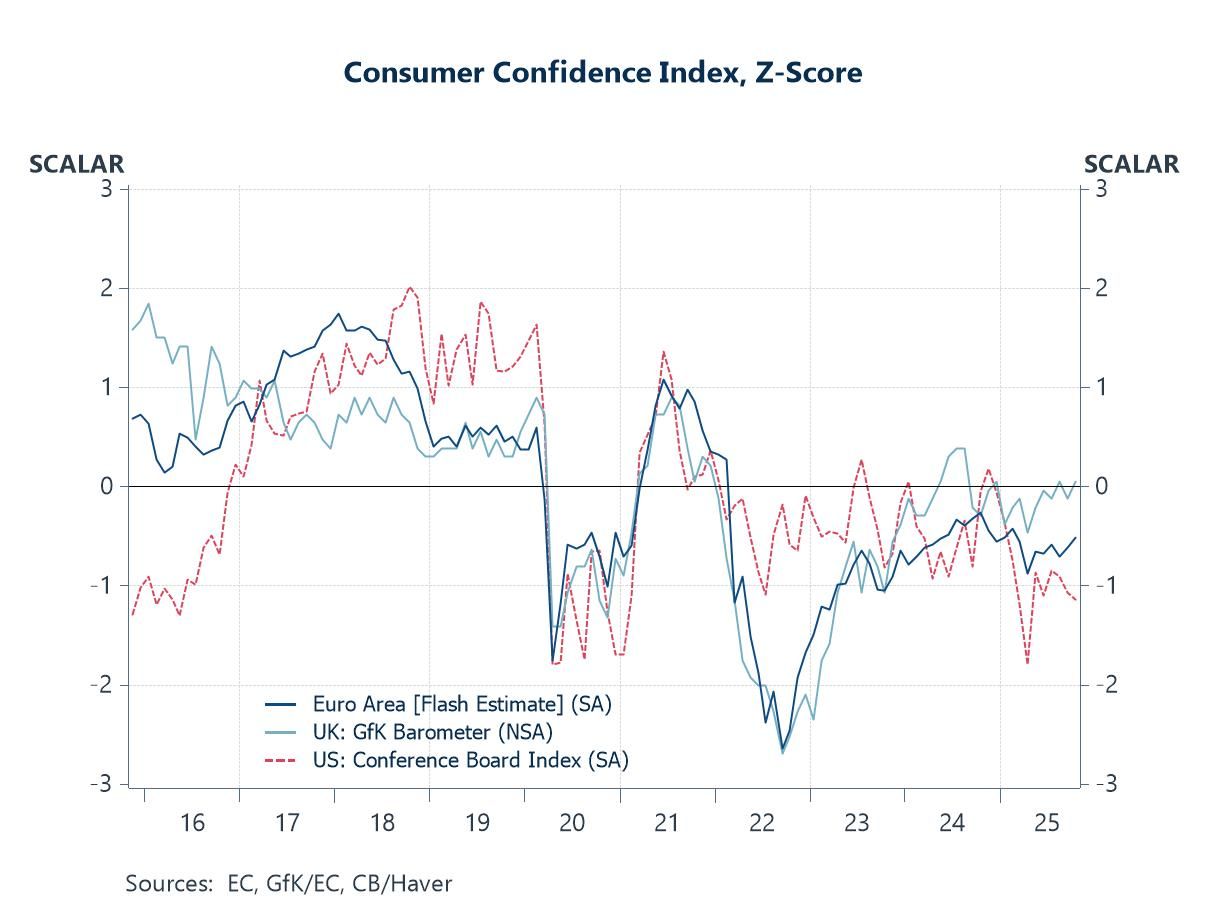
Consumer confidence in the US and Europe Consumer confidence trends have diverged across major economies in 2025. In the UK, sentiment has improved gradually, supported by easing inflation and lower interest rates. In the euro area, confidence has stabilised after a prolonged downturn, though households remain wary. By contrast, US confidence has slipped further, probably reflecting a softening labour market, slowing wage growth, and heightened concern about job security. Overall, global consumer sentiment remains fragile and uneven, suggesting that household spending could stay subdued even if price pressures recede and monetary policy becomes more accommodative.
Chart 3: Consumer confidence gauges for the US, euro area and UK
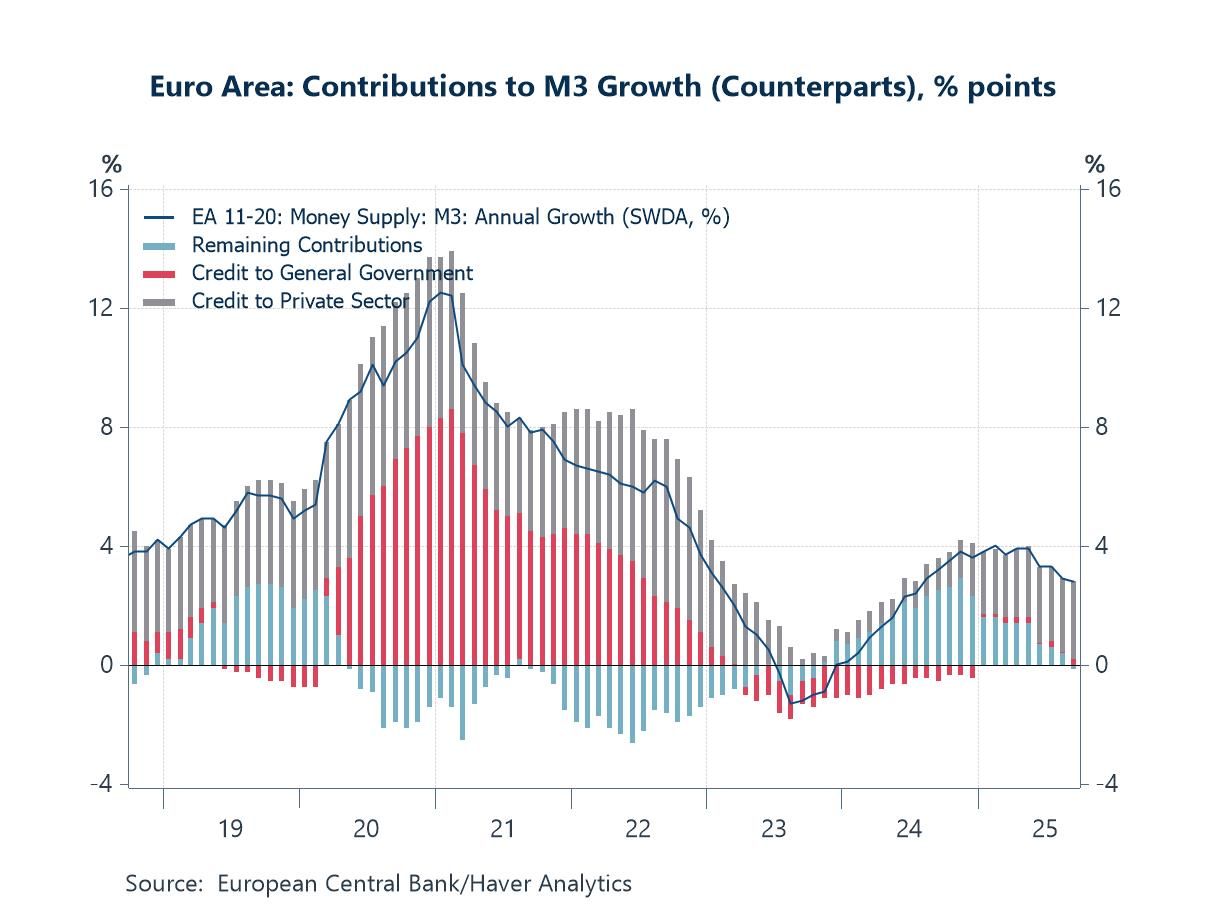
Credit conditions in the euro area The latest data on Euro Area M3 growth underline that monetary conditions remain mildly restrictive, even after the ECB’s recent rate reductions. Money growth has decelerated sharply over the past year, with only a limited contribution from private-sector credit and little net support from lending to government. The ECB’s Q4 Bank Lending Survey, released this week, suggests that while financing conditions are beginning to ease, credit dynamics remain weak. Banks reported a further net tightening of credit standards for firms, reflecting continued risk aversion, even as loan demand from businesses and households picked up modestly thanks to lower interest rates and improving sentiment.
Chart 4: Contributions to euro area M3 growth
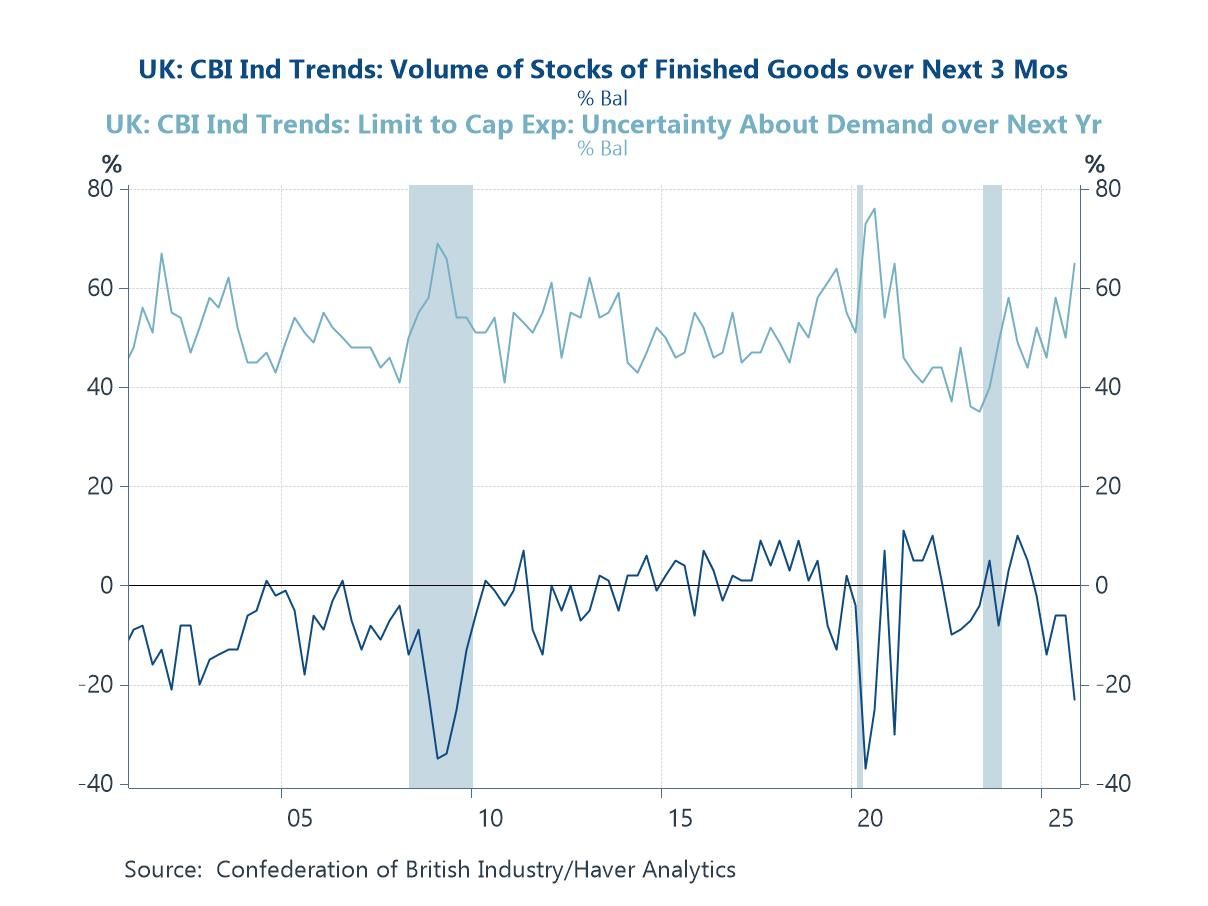
The UK manufacturing sector Turning to the UK, the latest CBI Industrial Trends Survey offers little sign of improvement in manufacturing conditions. The balance of firms reporting excess stocks of finished goods has fallen further into negative territory, consistent with efforts to run down inventories amid weak demand and high uncertainty. And on that score, the share of firms citing uncertainty about demand over the next year as a constraint on capital expenditure has shifted up, highlighting persistent caution in investment planning. Together, these indicators point to a sector still struggling to regain momentum after a protracted slowdown—one where firms are prioritising cost control and liquidity preservation over expansion, despite an easing in headline inflation and gradual monetary policy support.
Chart 5: UK CBI manufacturing survey: Uncertainty about demand versus finished inventory
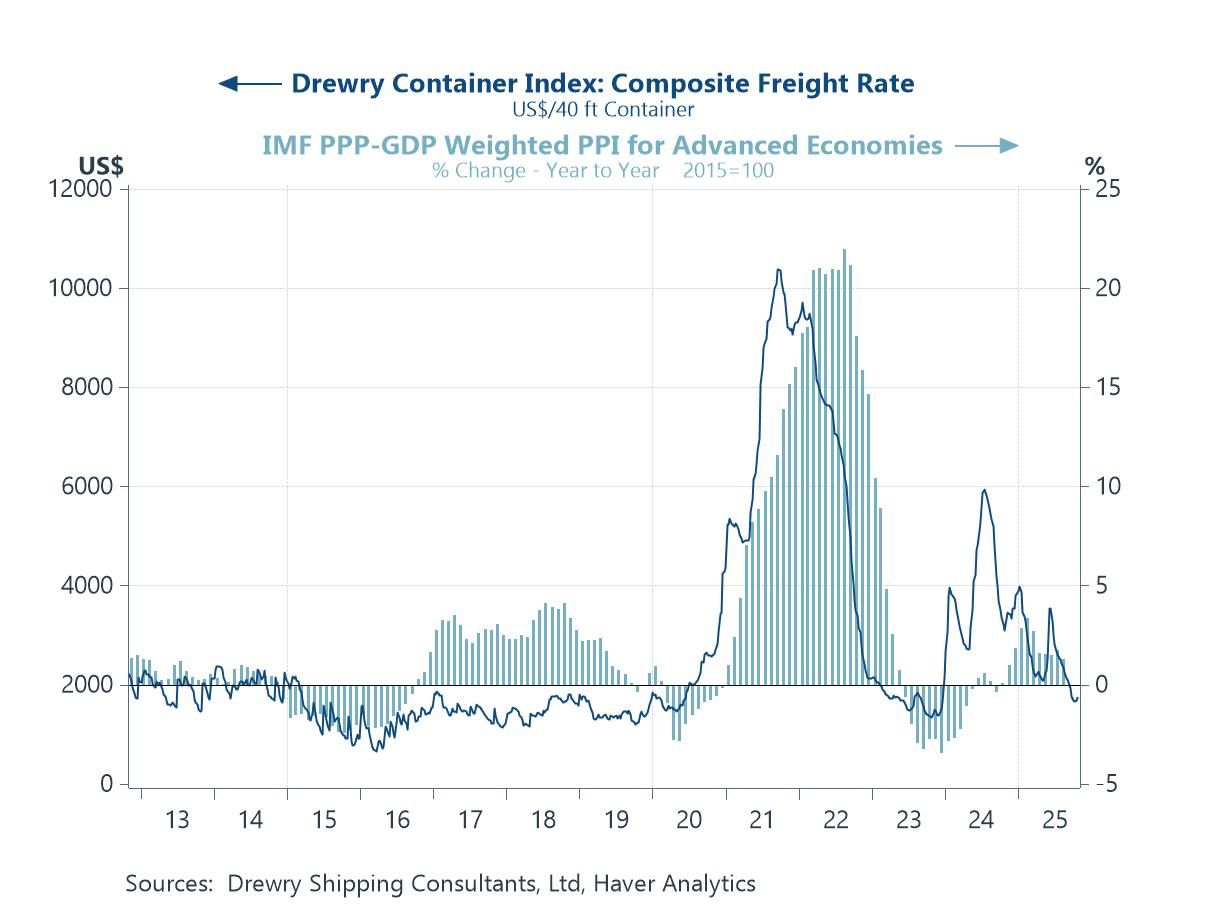
Traded goods price inflation The Drewry Container Index, which tracks global shipping costs for a standard 40-foot container, has fallen back in recent months from the elevated levels seen in 2024, reflecting softer global trade volumes and a partial unwinding of last year’s supply-chain pressures. Even so, concerns have re-emerged that new US tariff measures and associated logistical bottlenecks could push freight rates and producer price inflation (PPI) higher in the coming months. The final chart below illustrates how closely traded goods price inflation, represented by Haver’s aggregation of PPI inflation for advanced economies, has tended to move with swings in container shipping costs. While traded goods inflation remains subdued for now, any renewed disruptions to global shipping routes or tariff-driven frictions could quickly feed through to higher input costs—especially in manufacturing sectors reliant on long and complex supply chains.
Chart 6: Aggregate PPI inflation in advanced economies versus the Drewry Container Index

Andrew Cates
AuthorMore in Author Profile »Andy Cates joined Haver Analytics as a Senior Economist in 2020. Andy has more than 25 years of experience forecasting the global economic outlook and in assessing the implications for policy settings and financial markets. He has held various senior positions in London in a number of Investment Banks including as Head of Developed Markets Economics at Nomura and as Chief Eurozone Economist at RBS. These followed a spell of 21 years as Senior International Economist at UBS, 5 of which were spent in Singapore. Prior to his time in financial services Andy was a UK economist at HM Treasury in London holding positions in the domestic forecasting and macroeconomic modelling units. He has a BA in Economics from the University of York and an MSc in Economics and Econometrics from the University of Southampton.
More Economy in Brief


