 Global| Mar 22 2011
UK Inflation Takes Another Step Up
Summary
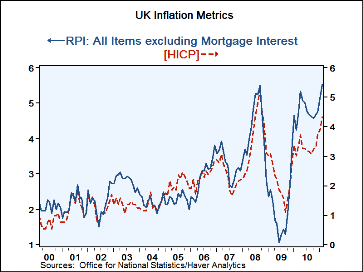
The UK HICP and RPIX indices rose sharply in February but slowed their pace from January, when the HICP rose by 0.9% and the RPIX rose by a sharp 1.1%. The measure of core inflation lags. But the core rate has been accelerating as the [...]
 The UK HICP and RPIX indices rose sharply in February but slowed their pace from January, when the HICP rose by 0.9% and the RPIX
rose by a sharp 1.1%. The measure of core inflation lags. But the core rate has been accelerating as the headline pace has risen.
With headline inflation up at a pace of 8.2% over three months the core on a one-month lag is at a pace of 4.7% Headline inflation
has risen steadily from 4.3% Yr/Yr to 6% over six months to its current 8.2%. The annualized pace of core inflation likewise has
risen from 3.3% over 12-months to 4% over six months to 4.7% over three months. The sequential growth in inflation is widespread
across the various RPI categories. Inflation in the UK really seems to have taken root
Inflation is more than twice the ceiling for inflation pursued by the Bank of England. Commodity prices are being blamed for the price run up. But the VAT has been hiked this year and it seems that, despite concerns about economic weakness, price increases are being passed along. Commodities after all are in the core of the HICP. That would seem to point to a rate hike sooner rather than later even with the split among BOE policymaking officials. It is being to look like BOE officials who are waiting for inflation to break by itself are waiting for Godot.
| UK HICP and RPI Inflation | |||||||
|---|---|---|---|---|---|---|---|
| % Mo/Mo | % SAAR | ||||||
| Feb-11 | Jan-11 | Dec-10 | 3-Mo | 6-Mo | 12-Mo | Yr Ago | |
| HICP | 0.5% | 0.8% | 0.7% | 8.2% | 6.0% | 4.3% | 3.0% |
| HICP Core -1Mo Lag | 0.5% | 0.3% | 0.4% | 4.7% | 4.0% | 3.3% | 3.1% |
| All Item RPI | 0.7% | 1.1% | 0.6% | 10.1% | 7.5% | 5.5% | 3.7% |
| RPIx | 0.7% | 1.0% | 0.6% | 9.5% | 7.3% | 5.5% | 4.2% |
| RPIxseas food | 0.7% | 1.1% | 0.6% | 10.0% | 7.5% | 5.5% | 3.8% |
| Food & Bev | 0.4% | 0.9% | 0.9% | 9.6% | 7.8% | 6.3% | 0.8% |
| Housing and HH expend | 0.3% | 1.1% | 0.5% | 7.9% | 4.5% | 3.4% | 0.8% |
| Clothing&Footwear | 4.9% | -1.0% | 0.3% | 17.7% | 17.9% | 12.7% | 2.4% |
| Leisure Services | 0.4% | 0.6% | 0.3% | 5.4% | 5.3% | 4.9% | 5.3% |
| Leisure Goods | 0.6% | -0.8% | 0.7% | 1.9% | 0.2% | 0.6% | 0.8% |
| Motoring expenditures | 1.3% | 1.9% | 1.6% | 21.2% | 16.7% | 10.5% | 17.1% |
| Fares and travel costs | 0.9% | 0.4% | 0.7% | 8.3% | 6.9% | 6.3% | 3.9% |
| A RED highlight indicates inflation accelerating from pace of previous horizon | |||||||
Robert Brusca
AuthorMore in Author Profile »Robert A. Brusca is Chief Economist of Fact and Opinion Economics, a consulting firm he founded in Manhattan. He has been an economist on Wall Street for over 25 years. He has visited central banking and large institutional clients in over 30 countries in his career as an economist. Mr. Brusca was a Divisional Research Chief at the Federal Reserve Bank of NY (Chief of the International Financial markets Division), a Fed Watcher at Irving Trust and Chief Economist at Nikko Securities International. He is widely quoted and appears in various media. Mr. Brusca holds an MA and Ph.D. in economics from Michigan State University and a BA in Economics from the University of Michigan. His research pursues his strong interests in non aligned policy economics as well as international economics. FAO Economics’ research targets investors to assist them in making better investment decisions in stocks, bonds and in a variety of international assets. The company does not manage money and has no conflicts in giving economic advice.


