 Global| Jul 22 2005
UK GDP Rises 0.4%, with Declining Factory Output Offset by Greater Oil & Gas Activity
Summary
UK GDP grew 0.4% in Q2, according to Office of National Statistics "Preliminary Estimate", the same as in Q1. This early estimate is compiled from industrial production and other industry data. It shows that manufacturing lost 0.7% on [...]
UK GDP grew 0.4% in Q2, according to Office of National Statistics "Preliminary Estimate", the same as in Q1. This early estimate is compiled from industrial production and other industry data. It shows that manufacturing lost 0.7% on the quarter, a somewhat smaller decline than in Q1; the year-on-year performance in manufacturing saw shrinkage of 1.7%, the second period of decrease after five straight quarters of year-on-year growth.
Services had moderate gains totaling 0.6% on the quarter, with three of the four major sectors participating: trade and other consumer services, business and financial services and government. Transportation and communications was flat. The overall performance for services was slightly weaker than 0.7% in Q1 and yielded a year-over-year increase of 2.5%, the slowest since the spring of 2003.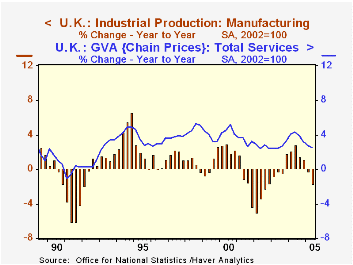
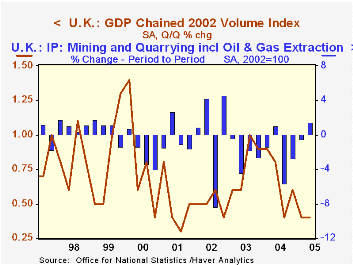
If these two bellwether sectors, manufacturing and services, were down or slower, how was Q2 GDP growth maintained at the Q1 rate? Mining activity including oil and gas extraction turned up after three successive, sizable declines. Renewed expansion in this industry sounds quite reasonable in view of the rapidly rising prices, but it remains to be seen if it will continue; during its general downtrend of the last three years, there have been isolated quarters of advance. The other expanding sector in Q1 was energy production, that is, electricity and other utilities. Construction output rose 0.4%, somewhat less than the 0.6% in Q1.
So all of this produced total GDP growth of 1.7% year-on-year, the smallest such increase since Q1 1993. We'd surmise that escalating energy costs are weighing on real growth. Also in the UK, base lending rates have been 4.75% for roughly the past year; in the face of just 2% consumer price inflation over that period, "real" interest charges are also exerting downward pressure. It shows.
| United Kingdom | Q2 2005 | Q1 2005 | Year/Year | 2004 | 2003 | 2002 |
|---|---|---|---|---|---|---|
| GDP | 0.4 | 0.4 | 1.7 | 3.2 | 2.5 | 2.0 |
| Manufacturing | -0.7 | -1.0 | -1.7 | 1.9 | 0.1 | -3.1 |
| Mining inc Oil Extraction | 1.4 | -0.5 | -7.3 | -7.9 | -5.2 | -0.3 |
| Services | 0.6 | 0.7 | 2.5 | 3.9 | 2.7 | 2.7 |
Carol Stone, CBE
AuthorMore in Author Profile »Carol Stone, CBE came to Haver Analytics in 2003 following more than 35 years as a financial market economist at major Wall Street financial institutions, most especially Merrill Lynch and Nomura Securities. She had broad experience in analysis and forecasting of flow-of-funds accounts, the federal budget and Federal Reserve operations. At Nomura Securities, among other duties, she developed various indicator forecasting tools and edited a daily global publication produced in London and New York for readers in Tokyo. At Haver Analytics, Carol was a member of the Research Department, aiding database managers with research and documentation efforts, as well as posting commentary on select economic reports. In addition, she conducted Ways-of-the-World, a blog on economic issues for an Episcopal-Church-affiliated website, The Geranium Farm. During her career, Carol served as an officer of the Money Marketeers and the Downtown Economists Club. She had a PhD from NYU's Stern School of Business. She lived in Brooklyn, New York, and had a weekend home on Long Island.
More Economy in Brief


