 Global| Feb 23 2010
U.S. Weekly Gasoline PricesRecover Somewhat
by:Tom Moeller
|in:Economy in Brief
Summary
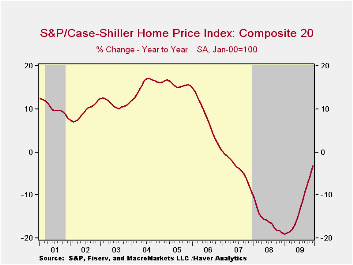
Ever-so-slightly, home prices are rising m/m and the annual decline has eased. The December S&P/Case Shiller Home Price Index edged up another 0.3% and they have risen 3.6% from the May low. That improvement pared the 12-month price [...]
 Ever-so-slightly,
home prices are rising m/m and the annual decline has
eased. The December S&P/Case Shiller Home Price Index edged up
another 0.3% and they have risen 3.6% from the May low. That
improvement pared the 12-month price decline to 3.1% from its worst of
-19.0% last January. For 2009 as a whole, prices fell 13.3% and they
have fallen 29.4% from the early-2006 peak.
Ever-so-slightly,
home prices are rising m/m and the annual decline has
eased. The December S&P/Case Shiller Home Price Index edged up
another 0.3% and they have risen 3.6% from the May low. That
improvement pared the 12-month price decline to 3.1% from its worst of
-19.0% last January. For 2009 as a whole, prices fell 13.3% and they
have fallen 29.4% from the early-2006 peak.
The narrower 10 City Composite Index also gained 0.3% following three months of 0.2% increase. As a result, the 12-month decline eased to -2.4% from -19.4% at its worst. These negative comparisons by far outpace those during the 1990-91 recession when home prices fell 6.3%.
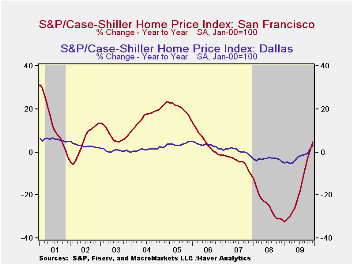
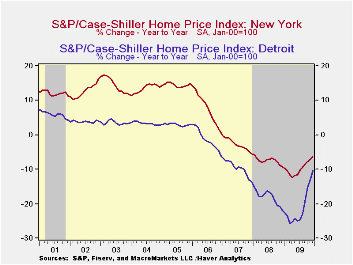
The performance of home prices has been quite varied around the country. During December, price gains near or above 1.0% were logged in Boston, Las Vegas, San Diego, San Francisco and Phoenix but prices still fell in Chicago, Miami, New York, Cleveland, and Tampa.
The Case Shiller home price series are value-weighted, i.e., a greater index weight is assigned to more expensive homes. The S&P/Case-Shiller home price series can be found in Haver's USECON database and the city data highlighted below is in the REGIONAL database.
Mortgage Choice and the Pricing of Fixed-Rate and Adjustable-Rate Mortgages from the Federal Reserve Bank of San Francisco is available here here.
| S&P/Case-Shiller Home Price Index (SA, Jan 00 = 100) | December m/m | November m/m | October m/m | Dec. y/y | 2009 | 2008 | 2007 |
|---|---|---|---|---|---|---|---|
| 20 City Composite Index | 0.3% | 0.3% | 0.2% | -3.1% | -13.3% | -15.7% | -3.8% |
| Regional Indicators | |||||||
| Atlanta | -0.0 | 0.2 | -0.3 | -3.9 | -11.6 | -8.5 | 0.7 |
| Boston | 0.9 | 0.5 | -0.3 | 0.5 | -4.9 | -5.7 | -4.0 |
| Chicago | -0.6 | -0.6 | -1.1 | -7.2 | -14.2 | -10.0 | -1.0 |
| Dallas | 0.1 | 0.6 | 0.2 | 3.0 | -2.3 | -3.2 | 0.5 |
| Denver | 0.1 | 0.2 | 0.3 | 1.2 | -2.8 | -4.9 | -1.7 |
| Los Angeles | 1.4 | 1.2 | 0.7 | -0.1 | -15.4 | -24.2 | -5.2 |
| New York | -0.5 | -0.9 | -0.4 | -6.3 | -9.8 | -7.4 | -2.8 |
| San Francisco | 1.0 | 1.2 | 1.7 | 4.8 | -18.4 | -24.3 | -4.5 |

Tom Moeller
AuthorMore in Author Profile »Prior to joining Haver Analytics in 2000, Mr. Moeller worked as the Economist at Chancellor Capital Management from 1985 to 1999. There, he developed comprehensive economic forecasts and interpreted economic data for equity and fixed income portfolio managers. Also at Chancellor, Mr. Moeller worked as an equity analyst and was responsible for researching and rating companies in the economically sensitive automobile and housing industries for investment in Chancellor’s equity portfolio. Prior to joining Chancellor, Mr. Moeller was an Economist at Citibank from 1979 to 1984. He also analyzed pricing behavior in the metals industry for the Council on Wage and Price Stability in Washington, D.C. In 1999, Mr. Moeller received the award for most accurate forecast from the Forecasters' Club of New York. From 1990 to 1992 he was President of the New York Association for Business Economists. Mr. Moeller earned an M.B.A. in Finance from Fordham University, where he graduated in 1987. He holds a Bachelor of Arts in Economics from George Washington University.
More Economy in Brief


