 Global| Feb 11 2009
U.S. Trade Deficit NarrowedFurther With Global Recession and Lower Oil Prices
by:Tom Moeller
|in:Economy in Brief
Summary
The December U.S. foreign trade deficit narrowed sharply to its shallowest since late 2003 as the global recession continued and oil prices fell further. The decline to $39.9B from an upwardly revised November deficit of $41.6B fell [...]
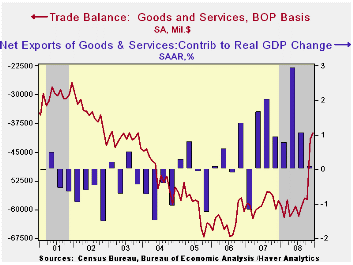
The December U.S. foreign trade deficit narrowed sharply to its shallowest since late 2003 as the global recession continued and oil prices fell further. The decline to $39.9B from an upwardly revised November deficit of $41.6B fell short, however, of Consensus expectations for a deficit of $36.0B.
For all of 2008, the trade deficit narrowed to $677.1B from the 2007 deficit of $700.3B. The latest was the lowest deficit since 2003. At 4.7%, last year's deficit as a percentage of GDP also was the lowest since 2003.
Adjusted for price inflation the trade deficit in goods narrowed last year as well. It fell more than $10.0B versus 2007 to 534.3B as real exports rose 6.5%, lifted by strength early in the year, and real imports fell 3.4%.
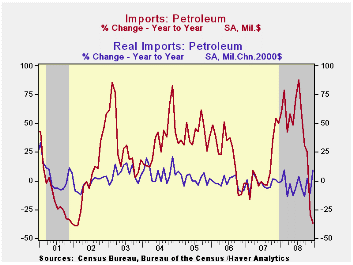
Lower oil prices caused December petroleum imports to drop by
6.7%. However, they rose by more than one-third for the full year due
to the gains in early 2008. For December, in volume terms, petroleum
imports rose a strong 23.3% (+9.6% y/y), but they were down for the
full year. The quantity of crude petroleum imports made up all of their
November decline with an 18.3% rise (+7.4% y/y). Moving the other way,
of course, was the average price per barrel of crude oil which fell to
$49.93 (-39.7% y/y) from a high of $124.7 in July.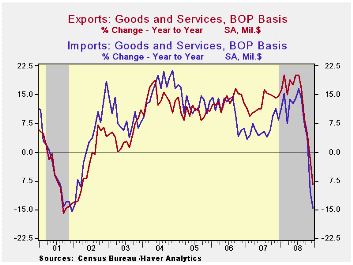
Reflecting the U.S. recession, measured in chained-2000 dollars, nonoil imports fell 5.6% (-13.7% y/y) after a similar decline during November. Real imports of nonauto consumer goods fell 1.3% (-10.3% y/y) to their lowest level since early 2006. The chained-dollar value of imports of automotive vehicles & parts fell a sharp 9.2% (-28.8% y/y) and real imports of nonauto capital goods dropped 4.1%, down 11.1% from December of 2007.
Services imports slipped 0.4% (+3.3% y/y). Travel imports made up most of a November drop with a 1.6% increase (+0.7% y/y) while passenger fares again fell hard, by 1.5% but they were up 5.7% year-to-year. That strong year-to-year was reduced from the 20.5% increase early last year.
Recessions abroad lowered U.S. exports of goods for the fifth consecutive month. The 8.5% decline (-12.9% y/y) was the fifth in row. Adjusted for prices, chained-dollar goods exports fell 6.0% (-8.5% y/y) as real exports of capital goods declined 1.4% (-9.1% y/y) for the fourth consecutive monthly drop. Exports of nonauto consumer goods fell a huge 5.8% (-4.7% y/y) and they are off 16.7% during the last five months. Real exports of automobiles & parts registered another double digit decline with a 14.0% drop and they're off by more than one-third during the last five months.
Nominal exports of services slipped 0.4% (+1.8% y/y) for the
fourth consecutive monthly drop. Travel exports made up 1.0% (-0.4%
y/y) following three months of sharp decline. Passenger fares also rose
by a slight 0.7% (0.7% y/y).
The U.S. trade deficit in goods with China narrowed again, to $19.9B, the smallest since March. For the whole year the deficit deepened, however, to $266.3 billion. Exports to China last year declined by nearly one-quarter, December-to-December, while imports fell just 2.2% y/y. The trade deficit with Japan narrowed m/m to $5.3B and for the whole year it narrowed to $72.7B which was the shallowest since 2003. Exports to Japan rose 6.2% during all of last year while imports fell 4.3% after a 1.8% decline during 2007.
Federal Reserve programs to strengthen credit markets and the economy is yesterday's testimony by Fed Chairman Ben S. Bernanke and it can be found here.
| Foreign Trade | December | November | Y/Y | 2008 | 2007 | 2006 |
|---|---|---|---|---|---|---|
| U.S. Trade Deficit | $39.9 | $41.6B | $57.6B (12/07) | $677.1 | $700.3 | $753.3 |
| Exports - Goods & Services | -6.0% | -6.0% | -8.4% | 12.0% | 13.0% | 13.5% |
| Imports - Goods & Services | -5.5% | -11.9% | -14.7% | 7.4 | 6.1% | 10.8% |
| Petroleum | -6.7% | -36.2% | -36.5% | 37.0 | 9.4% | 20.1% |
| Nonpetroleum Goods | -6.4% | -7.6% | -13.1% | 1.3% | 4.8% | 9.1% |
by Robert Brusca February 10, 2009
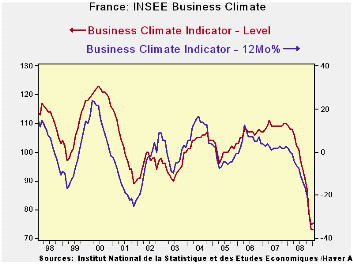
The Insee survey of French industry held steady at a reading
of 73, the first time the index did not fall month-to-month since March
2008. The index and its trend are on their lowest reading since 1990
The likely trend reading is in the lower 3 percent of its range Orders
and demand are a bottom 12% range reading on the month. Likely prices
are at the 34th percentile if their range. These readings remain very
weak.
French Finance minister Christine Lagarde predicts 1.2-point
drop in GDP For 4Q 2008. She said that official figures would very
probably show the French economy contracted by 1.2% in the fourth
quarter of 2008. It’s obviously too soon to try to build a positive
outlook from the flattening in the INSEE index.
| INSEE Industry Survey | ||||||||||
|---|---|---|---|---|---|---|---|---|---|---|
| Since Jan 1990 | Since Jan 1990 | |||||||||
| Jan 09 |
Dec 08 |
Nov 08 |
Oct 08 |
Percentile | Rank | Max | Min | Range | Mean | |
| Climate | 73 | 73 | 79 | 87 | 0.0 | 221 | 123 | 73 | 50 | 101 |
| Production | ||||||||||
| Recent Trend | -74 | -72 | -68 | -65 | 0.0 | 222 | 44 | -74 | 118 | -7 |
| Likely trend | -33 | -35 | -26 | -19 | 3.1 | 221 | 30 | -35 | 65 | 5 |
| Orders/Demand | ||||||||||
| Orders&Demand | -51 | -56 | -43 | -31 | 12.6 | 213 | 25 | -62 | 87 | -15 |
| FgnOrders&Demand | -50 | -55 | -47 | -26 | 9.0 | 212 | 31 | -58 | 89 | -11 |
| Prices | ||||||||||
| Likely Sales Price Trend | -7 | -9 | -1 | 9 | 34.0 | 166 | 24 | -23 | 47 | 1 |
by Tom Moeller February 11, 2009
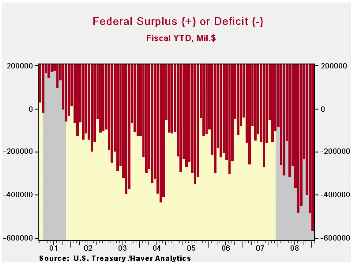
The U.S. government's January budget deficit continued to reflect the combined effects of a U.S. recession and two wars.The monthly deficit rose to $83.8 billion. Like December's figure, however, the relatively moderate deficit compares to a usual budget surplus for the month. For the first four months of this fiscal year the government's budget deficit totaled $569.0 billion. That compares to a deficit of $89.0 billion during last fiscal year's first four months. Consensus projections were for a January deficit of $79.0B.
Many forecasts for the budget deficit during all of this fiscal year are near $700B. If realized, that would swell the deficit to about 5% of GDP following last year's roughly 3.2% and FY07's marginal 1.2%. The Congressional Budget Office's recent deficit estimate of $1.2 trillion amounts to 8.3% of GDP. It assumes that revenues will fall 6.6% year-to-year and that outlays will increase 19.0%.
Adjusted for cyclicality, the CBO's latest "standardized" budget deficit estimate totaled 0.9% of GDP for 2009. The estimate was made in December.
Net revenues during January fell 11.4% from last year and for
the first four months of FY09 they were down 10.2%. Individual income
tax receipts reflected lower employment levels and fell 7.7%
year-to-year. Corporate tax receipts were hit even harder and they fell
by more than one-third. Growth in unemployment and social insurance
taxes grew just 1.0%, the least since late 2003.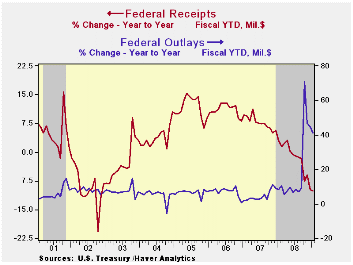
U.S. government outlays surged by forty-one percent from last fiscal year's first four months. Defense spending (19% of total outlays) rose 8.9%. The gain does not reflect the full cost of the resources devoted to Iraq & Afghanistan since much of the spending would have occurred anyway. Medicare expenditures (12% of outlays) jumped by 22.4% and "income security" spending (11% of outlays) jumped 25.7% after 7.5% growth last year. Social security payments rose 6.4% but net interest payments fell by more than one-quarter with lower interest rates.
The Government's financial data are available in Haver's USECON database, with extensive detail available in the specialized GOVFIN.
The Congressional Budget Office's Summary of Estimated Cost of H.R. 1, The American Recovery and Reinvestment Act of 2009 as Passed by the Senate on February 10, 2009 can be found here.
| US Government Finance | January | December | Y/Y | FY 2008 | FY 2007 | FY 2006 |
|---|---|---|---|---|---|---|
| Budget Balance | -$83.8B | $-83.6B | $17.8B (1/08) |
-$454.8B | -$161.5B | -$248.2B |
| Net Revenues | $226.1B | $237.8B | -11.4% | -1.7% | 6.7% | 11.8% |
| Net Outlays | $309.9B | $321.4B | 30.6% | 9.1% | 2.8% | 7.4% |

Tom Moeller
AuthorMore in Author Profile »Prior to joining Haver Analytics in 2000, Mr. Moeller worked as the Economist at Chancellor Capital Management from 1985 to 1999. There, he developed comprehensive economic forecasts and interpreted economic data for equity and fixed income portfolio managers. Also at Chancellor, Mr. Moeller worked as an equity analyst and was responsible for researching and rating companies in the economically sensitive automobile and housing industries for investment in Chancellor’s equity portfolio. Prior to joining Chancellor, Mr. Moeller was an Economist at Citibank from 1979 to 1984. He also analyzed pricing behavior in the metals industry for the Council on Wage and Price Stability in Washington, D.C. In 1999, Mr. Moeller received the award for most accurate forecast from the Forecasters' Club of New York. From 1990 to 1992 he was President of the New York Association for Business Economists. Mr. Moeller earned an M.B.A. in Finance from Fordham University, where he graduated in 1987. He holds a Bachelor of Arts in Economics from George Washington University.
More Economy in Brief


