 Global| Sep 11 2008
U.S. Trade Deficit Deepened As Oil Prices Rose
by:Tom Moeller
|in:Economy in Brief
Summary
The U.S. foreign trade deficit for July reversed its earlier improvement and deepened to $62.2B after shrinking to $58.8B in June which was deeper than reported last month. A deficit of $58.0B had been the Consensus expectation for [...]
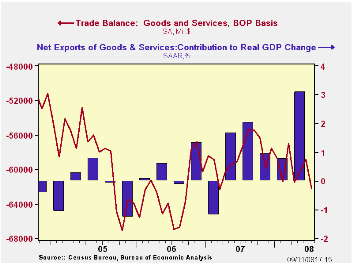
The U.S. foreign trade deficit for July reversed its earlier improvement and deepened to $62.2B after shrinking to $58.8B in June which was deeper than reported last month. A deficit of $58.0B had been the Consensus expectation for July. So far this year the monthly trade deficit has averaged $60.0B, slightly deeper than the $59.4B averaged during the first seven months of 2007.
Adjusted for price inflation, the July trade deficit in goods deepened slightly to $41.2B from $40.1B in June. Year-to-date the real deficit has narrowed by more than $10.0B versus 2007 to an average $45.7B as exports surged and real import growth dropped.
During 2Q08 a narrower trade deficit added 3.1 percentage points to real GDP growth after a 0.8 point addition during 1Q. U.S. exports again were strong in July and they rose 2.0% m/m after a downwardly revised 3.6% increase during June.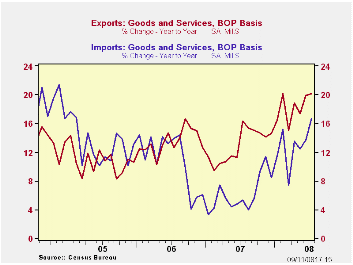
Goods exports rose during July by 3.9% (23.2% y/y) after a little-revised 4.9% jump during June. Adjusted for prices, chained dollar exports rose 2.0% (12.1% y/y). Real exports of nonauto consumer goods continued strong and surged 5.0% (17.4% y/y) after a like increase during June. Real exports of capital goods again were strong and increased 2.0% (7.8% y/y). Exports of autos, parts & engines jumped 12.6% (10.9% y/y) but real exports foods, feeds & beverages fell 7.1% (+6.3% y/y).
Exports of services again were strong and they rose 1.8% (11.5% y/y). Travel exports rose 2.0% (18.8% y/y) as during June and passenger fares rose 1.6% (31.4% y/y).
Overall, imports posted a strong 3.9% jump as petroleum imports surged 13.7% due to higher prices. Imports have nearly doubled since one year earlier. Adjusted for the higher prices, petroleum imports rose a lesser 8.0% (3.8% y/y) during July. The quantity of energy-related imports of petroleum products jumped 4.5% y/y while the average cost for a barrel of crude oil during July was $124.66 (90.1% y/y). Since July prices have fallen significantly and that should begin to reverse much of the trade deficit's deterioration.
Month-to-month, imports of nonpetroleum products during July rose 1.1% after a little-revised 1.3% decline during June. Measured in chained 2000 dollars nonoil imports inched up 0.3% (-2.7% y/y) after a revised 2.0% drop during June. In chained dollars imports of capital goods reversed just part of their June decline with a 1.2% (2.9% y/y) increase. Real imports of automotive vehicles & parts were weak again and they fell by 0.6% (-10.6% y/y).Chained imports of nonauto consumer goods fell for the second consecutive month, in July by 0.4% (+2.1% y/y).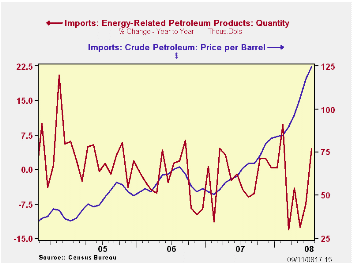
Services imports increased 1.7% (8.4% y/y) as travel imports jumped 1.5% (9.2% y/y) and passenger fares increased 3.0% (18.0% y/y).
The U.S. trade deficit in goods with China deepened slightly m/m to $21.4B. The deficit with China during the first seven months of this year was roughly the same as during the first seven months of 2007. Growth in exports to China spiked to 34.3% y/y in July and imports rose 9.5%. That was down from the 11.7% increase during all of 2007. With Japan, the trade deficit deepened slightly to $6.3B as exports fell 5.8% (+16.2% y/y) and imports dropped 1.2% (-6.2% y/y).
Did Large Recalls of Chinese Consumer Goods Lower U.S. Imports from China? from the Federal Reserve Bank of San Francisco can be found here.
| Foreign Trade | July | June | Y/Y | 2007 | 2006 | 2005 |
|---|---|---|---|---|---|---|
| U.S. Trade Deficit | $62.2B | $58.8B | $57.3B (7/07) | $700.3 | $753.3 | $711.6B |
| Exports - Goods & Services | 3.3% | 3.7% | 20.1% | 13.0% | 13.5% | 10.6% |
| Imports - Goods & Services | 3.9% | 2.1% | 16.8% | 6.1% | 10.8% | 12.8% |
| Petroleum | 13.7% | 16.4% | 88.8% | 9.4% | 20.1% | 39.6% |
| Nonpetroleum Goods | 1.1% | -1.3% | 4.5% | 4.8% | 9.1% | 10.3% |

Tom Moeller
AuthorMore in Author Profile »Prior to joining Haver Analytics in 2000, Mr. Moeller worked as the Economist at Chancellor Capital Management from 1985 to 1999. There, he developed comprehensive economic forecasts and interpreted economic data for equity and fixed income portfolio managers. Also at Chancellor, Mr. Moeller worked as an equity analyst and was responsible for researching and rating companies in the economically sensitive automobile and housing industries for investment in Chancellor’s equity portfolio. Prior to joining Chancellor, Mr. Moeller was an Economist at Citibank from 1979 to 1984. He also analyzed pricing behavior in the metals industry for the Council on Wage and Price Stability in Washington, D.C. In 1999, Mr. Moeller received the award for most accurate forecast from the Forecasters' Club of New York. From 1990 to 1992 he was President of the New York Association for Business Economists. Mr. Moeller earned an M.B.A. in Finance from Fordham University, where he graduated in 1987. He holds a Bachelor of Arts in Economics from George Washington University.
More Economy in Brief


