 Global| Sep 08 2009
U.S. Small Business OptimismImproves Slightly But Hiring Plans Drift To 27-Year Low
by:Tom Moeller
|in:Economy in Brief
Summary
Small business' optimism improved last month as the severe economic weakness of early this year passed. The National Federation of Independent Business (NFIB) indicated, however, that the improvement was not enough to generate an [...]
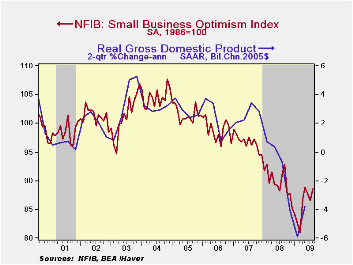
Small business' optimism improved last month as the severe economic weakness of early this year passed. The National Federation of Independent Business (NFIB) indicated, however, that the improvement was not enough to generate an increase in hiring intentions. Their small business optimism index rose to 88.6 during August after the slight July decline. The index remained improved from the lows of this past winter but were down from last year.During the last ten years, there has been an 85% correlation between the level of the NFIB index and the two-quarter change in real GDP.
The improvement in business' sentiment has done little,
however, to improve hiring intentions. The percentage of firms with one
or more job openings slipped to just 8% during August, the lowest level
since 1982. During the last ten years there has been a 74% correlation
between the NFIB employment percentage and the six-month change in
nonfarm payrolls. Still, the outlook has brightened slightly. The
percentage of firms planning to raise employment rose to a net-zero
from negative figures as low as -10 in March.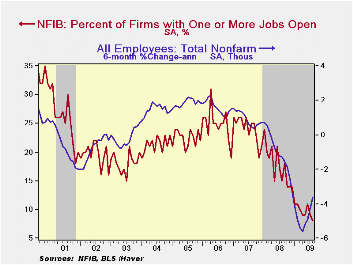
Perhaps this negativism will improve if the economy turns around as expected. The percentage of small businesses expecting the economy to improve bounced off its lows to 10 and that was back near the spring high. The percentage expecting credit conditions to ease, however, remained in its recent low range while the percentage reporting that now is a good time to expand business held stable in its modestly positive range of recent months.
As is normally the case, improvement in firms' capital spending intentions will wait for the economy to strengthen before they rise. During the next 3-6 months, plans for capital spending fell to a new series' low. This weakness in investment continues to reflect poor profits. Forty-percent of firms are reporting lower earnings this quarter versus last, though that is improved from the net -47% in January.
The largest, single most important problems seen by business were poor sales (32%), taxes (18%, lower the recent 22% high), government requirements (11%), insurance cost & availability (9%), competition from large businesses (8%) and inflation (5%).
The percentage of firms actually
raising prices (-19) slipped and remained near the record low.
During the last ten years there has been a 69% correlation between the
six-month change in the producer price index and the level of the NFIB
price index.The percentage of firms planning
to raise prices improved to a net 8 from the March low of 0. Worker
compensation also remained depressed near the series' lows.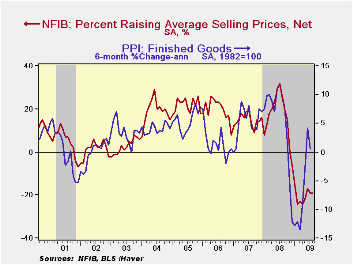
About 24 million small businesses exist in the United States. Small business creates 80% of all new jobs in America and the NFIB figures can be found in Haver's SURVEYS database.
Why Don't Lenders Renegotiate More Home Mortgages? Redefaults, Self-Cures, and Securitization from the Federal Reserve Bank of New England is available here.
| Nat'l Federation of Independent Business | August | July | Y/Y | 2008 | 2007 | 2006 |
|---|---|---|---|---|---|---|
| Small Business Optimism Index (SA, 1986=100) | 88.6 | 86.5 | -2.7% | 89.8 | 96.7 | 98.9 |
| Percent of Firms With One or More Job Openings | 8 | 9 | 15 | 18 | 24 | 25 |
| Percent of Firms Raising Avg. Selling Pric1es (Net) | -19 | -19 | 26 | 17 | 15 | 20 |
German Industrial Production Down: New Orders Up In July
by Louise Curley September 08, 2009
Data on German industrial production were released today.
Production in July fell 0.9% from June, contrary to expectations of a
continued rise. Production of electricity and other utilities was off
4.0%, construction, 2.4%, mining and quarrying, 1.6% and manufacturing
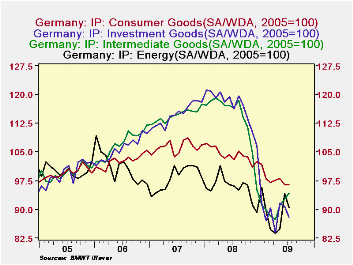
0.5%. In terms of the kind of goods produced, production of consumer
goods was flat, that of investment goods, down 3.2%, and energy
production, down 3.9%. The only positive sector was the production of
intermediate goods, which rose 1.8% suggesting that the inventory
liquidation evident in the second quarter GDP report may be abating or
even reversing. The first chart shows the production of these goods.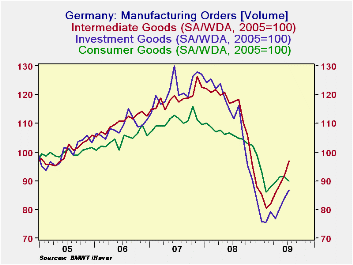
Data on manufacturing new orders were released yesterday and were generally more positive than the production data, but still a little cautionary in some of the details. The total volume of manufacturing new orders increased 3.5% in July, The rise was due entirely to a big increase of 10.3% in domestic new orders. Foreign orders actually fell 2.3%. Orders for intermediate goods increased 5.2% in the month of July while orders for investment goods were up 3.2%; however, orders for consumer goods fell 1.5%. The second chart show the orders for these three types of goods.
| GERMANY | ||||||||
|---|---|---|---|---|---|---|---|---|
| INDUSTRIAL PRODUCTION (2005=100) | Jul 09 | Jun 09 | Jul 08 | M/M % | Y/Y % | 2008 | 2007 | 2006 |
| Electricity and other utilities | 92.4 | 96.2 | 97.6 | -3.95 | -5.23 | 96.3 | 98.0 | 101.4 |
| Construction | 104.2 | 106.7 | 101.8 | -2.34 | 2.36 | 108.2 | 108.9 | 105.8 |
| Mining and Quarrying | 114.2 | 116.1 | 107.2 | -1.64 | 6.43 | 110.4 | 12407 | 95.9 |
| Manufacturing | 91.7 | 95.2 | 113.6 | -0.54 | -19.28 | 113.1 | 112.7 | 105.8 |
| Intermediate Goods | 94.1 | 92.7 | 116.5 | 1.83 | -18.97 | 114.0 | 114.6 | 107.1 |
| Investment Goods | 87.9 | 90.8 | 116.2 | -3.19 | -24.35 | 116.9 | 114.8 | 105.9 |
| Consumer Goods | 96.5 | 96.5 | 102.9 | 0.00 | -6.22 | 104.3 | 106.3 | 102.4 |
| Energy Goods | 90.5 | 94.2 | 96.1 | -3.93 | -5.83 | 95.7 | 98.3 | 100.9 |
| MANUFACTURING NEW ORDERS (2005=100) | ||||||||
| Total | 90.7 | 87.6 | 113.3 | 3.54 | -19.95 | 111.3 | 119.7 | 108.9 |
| Domestic | 95.5 | 86.6 | 110.2 | 10.25 | -13.34 | 108.3 | 114.8 | 106.8 |
| Foreign | 86.5 | 88.5 | 116.0 | -2.26 | -25.43 | 113.8 | 124.0 | 110.8 |
| Intermediate Goods | 97.0 | 9202 | 117.5 | 5.21 | -17.45 | 113.1 | 118.7 | 110.2 |
| Investment Goods | 86.8 | 84.1 | 111.6 | 3.21 | -22.22 | 110.9 | 121.7 | 108.8 |
| Consumer Goods | 89.9 | 91.3 | 105.7 | -1.53 | -14.95 | 105.5 | 110.7 | 104.2 |

Tom Moeller
AuthorMore in Author Profile »Prior to joining Haver Analytics in 2000, Mr. Moeller worked as the Economist at Chancellor Capital Management from 1985 to 1999. There, he developed comprehensive economic forecasts and interpreted economic data for equity and fixed income portfolio managers. Also at Chancellor, Mr. Moeller worked as an equity analyst and was responsible for researching and rating companies in the economically sensitive automobile and housing industries for investment in Chancellor’s equity portfolio. Prior to joining Chancellor, Mr. Moeller was an Economist at Citibank from 1979 to 1984. He also analyzed pricing behavior in the metals industry for the Council on Wage and Price Stability in Washington, D.C. In 1999, Mr. Moeller received the award for most accurate forecast from the Forecasters' Club of New York. From 1990 to 1992 he was President of the New York Association for Business Economists. Mr. Moeller earned an M.B.A. in Finance from Fordham University, where he graduated in 1987. He holds a Bachelor of Arts in Economics from George Washington University.
More Economy in Brief


