 Global| Jul 14 2009
U.S. Small Business Optimism Slips From Eight Month High
by:Tom Moeller
|in:Economy in Brief
Summary
According to the National Federation of Independent Business (NFIB), small business optimism slipped last month from May but the index level of 87.8 still was its highest level since last November. Optimism remained down 1.6% from [...]
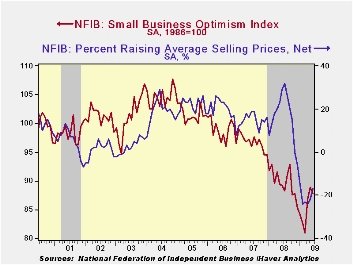
According to the National Federation of Independent Business (NFIB), small business optimism slipped last month from May but the index level of 87.8 still was its highest level since last November. Optimism remained down 1.6% from last year.
During the last ten years there has been a 49% correlation between the level of the NFIB index and the two-quarter change in real GDP.
The percentage planning to raise employment remained slightly negative but was at its highest level since October. The percentage of respondents with one or more job openings improved modestly to 11% but that was still near the least since 1982. During the last ten years there has been a 71% correlation between the NFIB employment percentage and the y/y change in nonfarm payrolls.
The latest rise in the overall index occurred as the percentage expecting the economy to improve slipped to 7% but that was the third consecutive month in positive territory. The percentage expecting credit conditions to ease remained in its recent range while the percentage reporting that now is a good time to expand the business slipped but also remained positive. During the next 3-6 months, plans for capital spending also remained range-bound and modestly positive.
The largest, single most important problems seen by business were poor sales (32%), taxes (19%), government requirements (15%), insurance cost and availability (7%), competition from large businesses (6%) and inflation (5%).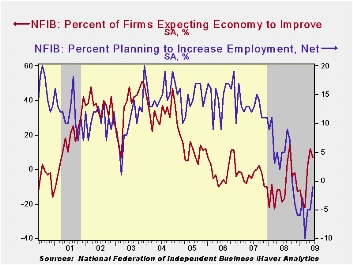
The percentage of firms planning to raise prices rose slightly to 5% but that still was near the record low. Though the figure improved modestly, the percentage of firms actually raising prices remained in negative territory near the record low. During the last ten years there has been a 69% correlation between the y/y change in the producer price index and the level of the NFIB price index.
About 24 million businesses exist in the United States. Small business creates 80% of all new jobs in America.
The NFIB figures can be found in Haver's SURVEYS database.
| Nat'l Federation of Independent Business | June | May | Y/Y | 2008 | 2007 | 2006 |
|---|---|---|---|---|---|---|
| Small Business Optimism Index (SA, 1986=100) | 87.8 | 88.9 | -1.6% | 89.8 | 96.7 | 98.9 |

Tom Moeller
AuthorMore in Author Profile »Prior to joining Haver Analytics in 2000, Mr. Moeller worked as the Economist at Chancellor Capital Management from 1985 to 1999. There, he developed comprehensive economic forecasts and interpreted economic data for equity and fixed income portfolio managers. Also at Chancellor, Mr. Moeller worked as an equity analyst and was responsible for researching and rating companies in the economically sensitive automobile and housing industries for investment in Chancellor’s equity portfolio. Prior to joining Chancellor, Mr. Moeller was an Economist at Citibank from 1979 to 1984. He also analyzed pricing behavior in the metals industry for the Council on Wage and Price Stability in Washington, D.C. In 1999, Mr. Moeller received the award for most accurate forecast from the Forecasters' Club of New York. From 1990 to 1992 he was President of the New York Association for Business Economists. Mr. Moeller earned an M.B.A. in Finance from Fordham University, where he graduated in 1987. He holds a Bachelor of Arts in Economics from George Washington University.