 Global| Sep 14 2004
U.S. Retail Spending Lackluster
by:Tom Moeller
|in:Economy in Brief
Summary
Retail sales fell 0.3% last month, about as expected, following a 0.8% gain in July that was little revised. Excluding motor vehicles & parts dealers sales rose 0.2% after a little revised 0.3% gain in July. Consensus expectations had [...]
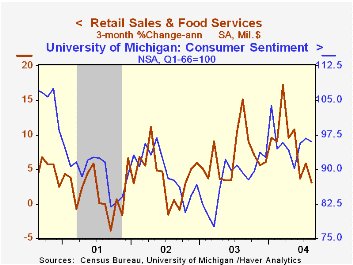
Retail sales fell 0.3% last month, about as expected, following a 0.8% gain in July that was little revised.
Excluding motor vehicles & parts dealers sales rose 0.2% after a little revised 0.3% gain in July. Consensus expectations had been for a 0.2% increase.
A lackluster tone to retail spending last month was emphasized by declines in discretionary spending. Clothing and accessory store sales fell 1.4% (+2.4% y/y), the fourth weak month in the last five.Sales at general merchandise stores slipped 0.4% (+3.8% y/y) after a downwardly revised 0.8% gain in July. Sales of furniture/home furnishings & electronics/appliances fell 0.4% (+5.9% y/y) although that followed upwardly revised gains of 1.2% and 1.8% in July and June.
Sales at gasoline service stations rose 0.3% (15.8% y/y) even though gasoline prices dropped 1.7% m/m in August0. So far in September gasoline prices are down another 1.6% to an average $1.85/gal.
| Aug | July | Y/Y | 2003 | 2002 | 2001 | |
|---|---|---|---|---|---|---|
| Retail Sales & Food Services | -0.3% | 0.8% | 4.9% | 5.4% | 2.5% | 3.1% |
| Excluding Autos | 0.2% | 0.3% | 7.0% | 5.2% | 3.2% | 3.1% |
by Tom Moeller September 14, 2004
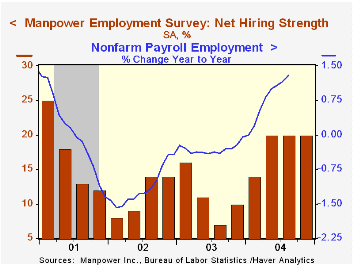
The Manpower Employment Outlook Survey continued to indicate improved hiring intentions in the US for 4Q04. A seasonally adjusted net 20% of 16,000 employers expect to increase hiring activity and that held the improved level of the prior two quarters.
Not seasonally adjusted, 28% of employers planned to raise employment versus 22% in 4Q03 while 7% planned to decrease the number of jobs versus 11% in 4Q03.
Since 1980 there has been a 75% correlation between the Manpower index and the y/y change in non-farm payrolls.
The latest press release from Manpower Inc. covering employment prospects in the United States can be viewed here.
| Manpower Employment Survey | 4Q 04 | 3Q 04 | 4Q 03 | 2003 | 2002 | 2001 |
|---|---|---|---|---|---|---|
| All Industries - Net Higher (SA) | 20 | 20 | 10 | 11 | 11 | 17 |
by Tom Moeller September 14, 2004
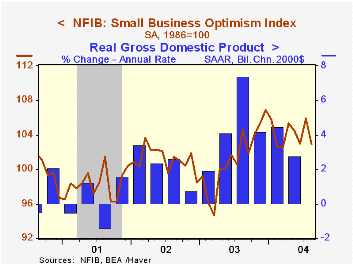
The Small Business Optimism Index published by the National Federation of Independent Business (NFIB) fell 2.8% in August. The decline reversed all of the improvement in July and dropped the index to the lowest level since March.
The percentage of firms expecting the economy to improve fell to 32% from 37% in July.
The percent of firms planning to raise employment rose to 19%, the highest percentage this year. During the last ten years there has been a 61% correlation between these hiring plans and the three month growth in nonfarm payrolls.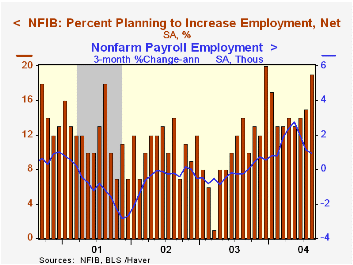
The percentage of firms raising average selling prices ticked slightly higher to 21% from 20% in July.
During the last ten years there has been a 68% correlation between the level of the NFIB index and the two quarter % change in real GDP.
About 24 million businesses exist in the United States. Small business creates 80% of all new jobs in America.
| Nat'l Federation of Independent Business | Aug | July | Y/Y | 2003 | 2002 | 2001 |
|---|---|---|---|---|---|---|
| Small Business Optimism Index (1986=100) | 102.9 | 105.9 | -1.6% | 101.3 | 101.2 | 98.4 |
by Tom Moeller September 14, 2004
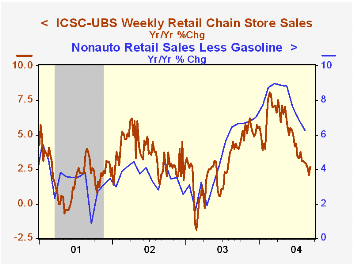
Chain store sales again ticked slightly higher last week, up 0.2% w/w according to the International Council of Shopping Centers (ICSC)-UBS.
So far in September sales are 0.1% below the August average which was unchanged from July.
During the last ten years there has been a 60% correlation between y/y change in chain store sales and the change in non-auto retail sales less gasoline.
The ICSC-UBS retail chain-store sales index is constructed using the same-store sales reported by 78 stores of seven retailers: Dayton Hudson, Federated, Kmart, May, J.C. Penney, Sears and Wal-Mart.
| ICSC-UBS (SA, 1977=100) | 09/11/04 | 09/04/04 | Y/Y | 2003 | 2002 | 2001 |
|---|---|---|---|---|---|---|
| Total Weekly Retail Chain Store Sales | 439.4 | 438.6 | 2.7% | 2.9% | 3.6% | 2.1% |
by Tom Moeller September 14, 2004
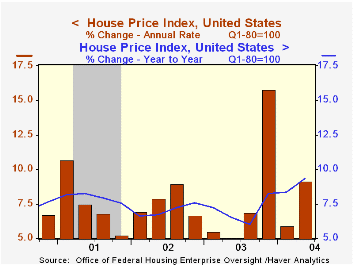
Home prices as tallied by the Office of Federal Housing Enterprise Oversight (OFHEO) rose 2.2% (9.1% AR) in 2Q 2004 versus an upwardly revised 1Q gain of 1.5%.
The OFHEO house price index is a geometric weighted average based on more than 26.5 million repeat transactions over 29 years and 12,000 transactions annually.
View the latest OFHEO release here.
| OFHEO | 2Q04 | 1Q04 | Y/Y | 2003 | 2002 | 2001 |
|---|---|---|---|---|---|---|
| House Price Index | 2.2% | 1.5% | 9.4% | 7.0% | 7.0% | 8.0% |
by Tom Moeller September 14, 2004
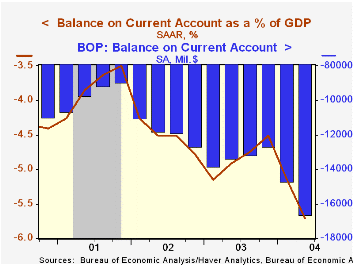
The US current account deficit deepened sharply to$166.2B in 2Q04, a new record. Consensus expectations had been for a 2Q deficit of $159.0B.
The deficit in goods trade deteriorated to $163.6B from $135.5B a year ago, driven by the huge rise in the June merchandise trade deficit reported last month.
Exports of goods, services & income in 2Q rose 3.2% (17.0% y/y) led by a 2.8% (14.2% y/y) rise in merchandise exports. Imports rose 6.7% (19.3% y/y) with merchandise imports up 5.3% (17.0% y/y).
The surplus on services rose slightly to $13.3B but so far this year is off the pace which in 2003 generated a surplus of $51.0B and $89.9B in 1997.
| US Int'l Balance of Payments | 2Q '04 | 1Q '04 | Y/Y | 2003 | 2002 | 2001 |
|---|---|---|---|---|---|---|
| Current Account Deficit | $166.2B | $147.2B | $133.9B | $530.7B | $473.9B | $385.7B |
| Goods/Services/Income Deficit | $147.6B | $126.4B | $117.5B | $463.2B | $414.6B | $339.1B |
| Exports | 3.2% | 2.1% | 17.0% | 5.8% | -3.9% | -9.0% |
| Imports | 6.7% | 5.3% | 19.3% | 7.3% | 1.5% | -8.2% |
| Unilateral Transfers Deficit | $18.5B | $20.7B | $16.4B | $67.4 | $59.4B | $46.6B |

Tom Moeller
AuthorMore in Author Profile »Prior to joining Haver Analytics in 2000, Mr. Moeller worked as the Economist at Chancellor Capital Management from 1985 to 1999. There, he developed comprehensive economic forecasts and interpreted economic data for equity and fixed income portfolio managers. Also at Chancellor, Mr. Moeller worked as an equity analyst and was responsible for researching and rating companies in the economically sensitive automobile and housing industries for investment in Chancellor’s equity portfolio. Prior to joining Chancellor, Mr. Moeller was an Economist at Citibank from 1979 to 1984. He also analyzed pricing behavior in the metals industry for the Council on Wage and Price Stability in Washington, D.C. In 1999, Mr. Moeller received the award for most accurate forecast from the Forecasters' Club of New York. From 1990 to 1992 he was President of the New York Association for Business Economists. Mr. Moeller earned an M.B.A. in Finance from Fordham University, where he graduated in 1987. He holds a Bachelor of Arts in Economics from George Washington University.
More Economy in Brief


