 Global| Apr 13 2004
U.S. Retail Sales Surge
by:Tom Moeller
|in:Economy in Brief
Summary
Retail sales surged 1.8% last month on the heels of a 1.0% jump in February. This surprising strength far exceeded Consensus expectations for a 0.7% March gain. Sales' gains in both February and January were revised up. Retail sales [...]
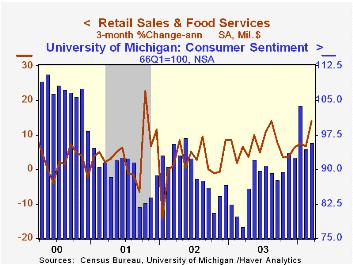
Retail sales surged 1.8% last month on the heels of a 1.0% jump in February. This surprising strength far exceeded Consensus expectations for a 0.7% March gain. Sales' gains in both February and January were revised up.
Retail sales excluding motor vehicles & parts dealers exploded with a 1.7% jump and February was revised to a 0.6% increase from the advance report of little change. Consensus expectations had been for a 0.6% increase in March.
A 10.6% m/m jump in sales for building materials, garden equipment & supply dealers (20.8% y/y) led the March sales strength and February as revised to +16.7% from the advance report of no change.
Clothing and accessory store sales also were strong and exploded 1.9% (9.6% y/y).Sales of furniture/home furnishings & electronics/appliances rose 0.7% (10.3% y/y) after an upwardly revised 0.4% February increase. Sales at general merchandise stores added another 0.3% (7.4% y/y) to the huge gains of the prior two months.
Motor vehicle dealers' sales rose a moderate 2.1% m/m as unit sales of light vehicles rose 1.9% to 16.68M. Sales at gasoline service stations rose 0.8% (3.9% y/y).
| Mar | Feb | Y/Y | 2003 | 2002 | 2001 | |
|---|---|---|---|---|---|---|
| Retail Sales & Food Services | 1.8% | 1.0% | 8.2% | 5.4% | 2.5% | 3.1% |
| Excluding Autos | 1.7% | 0.6% | 8.5% | 5.2% | 3.2% | 3.1% |
by Tom Moeller April 13, 2004
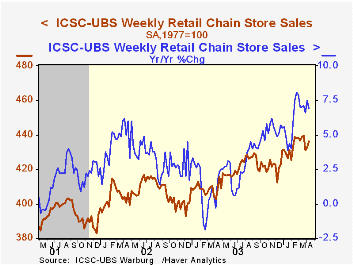
Chain store sales rose 0.8% in the week just before Easter following a 0.3% gain the period earlier, according to the International Council of Shopping Centers (ICSC)-UBS survey.
The level of sales so far in April, however, is disappointing. Due to a sharp 1.9% drop in late March, April sales are down 0.5% from the March average.
The ICSC-UBS retail chain-store sales index is constructed using the same-store sales reported by 78 stores of seven retailers: Dayton Hudson, Federated, Kmart, May, J.C. Penney, Sears and Wal-Mart.
During the last ten years there has been a 51% correlation between the year-to-year percent change in the ICSC-UBS measure of chain store sales and consumer sentiment.
| ICSC-UBS (SA, 1977=100) | 04/10/04 | 04/03/04 | Y/Y | 2003 | 2002 | 2001 |
|---|---|---|---|---|---|---|
| Total Weekly Retail Chain Store Sales | 436.1 | 432.5 | 6.9% | 2.9% | 3.6% | 2.1% |
by Tom Moeller April 13, 2004
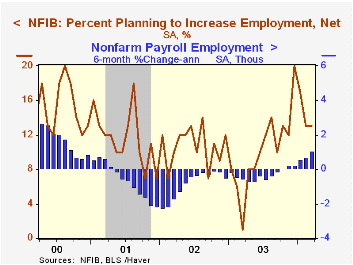
The Small Business Optimism Index published by the National Federation of Independent Business (NFIB) dipped 0.1% in March. The decline was the third in a row and pulled optimism 4.1% below December which was near the record high.
The m/m decline reflected another drop, to 22%, in the percent of firms expecting the economy to improve. Nevertheless, the percentage of firms expecting higher sales in six months rose to 29% and the percentage of firms planning to add to capital expenditures rose to 35%. The percentage planning to raise employment was stable at 13%, a figure much improved versus the lows of early last year.
During the last ten years there has been a 47% correlation between the level of the NFIB index and the y/y change in real GDP.
The percent of owners raising average selling prices rose to 19%, the highest level since June 2000.
About 24 million businesses exist in the United States. Small business creates 80% of all new jobs in America.
| Nat'l Federation of Independent Business | Mar | Feb | Y/Y | 2003 | 2002 | 2001 |
|---|---|---|---|---|---|---|
| Small Business Optimism Index (1986=100) | 102.5 | 102.6 | 8.2% | 101.3 | 101.2 | 98.4 |
by Tom Moeller April 13, 2004
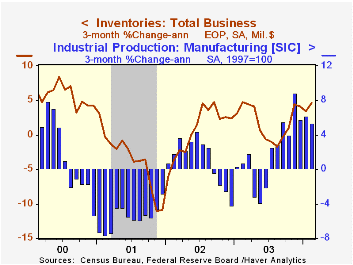
Total business inventories rose 0.7% in February for the sixth consecutive monthly increase. Consensus expectations were for a 0.3% increase.
Inventory additions lead production gains. During the last ten years there has been a 46% correlation between the three month change in business inventories and the three month change in US factory production. That correlation rises to 66% when the production gain is lagged six months.
Retail inventories rose 0.4% in February. The gain was mostly due to a rise in auto inventories. Non-auto inventories ticked just 0.1% higher. Recently, inventory accumulation has been scattered across retail sectors but year-to-year furniture/home furnishings (+6.5%), building materials (+9.9%) and motor vehicles (+6.3%) have been strong.
Overall business sales surged 0.5% (7.8% y/y) in February following a 0.3% January increase.
The inventory-to-sales ratio was unchanged at a record low 1.33.
| Business Inventories | Feb | Jan | Y/Y | 2003 | 2002 | 2001 |
|---|---|---|---|---|---|---|
| Total | 0.7% | 0.2% | 2.0% | 1.9% | 1.5% | -4.5% |
| Retail | 0.4% | -0.0% | 3.7% | 4.9% | 6.0% | -2.8% |
| Retail excl. Autos | 0.1% | -0.1% | 2.5% | 3.0% | 2.6% | -1.1% |
| Wholesale | 1.2% | 0.2% | 1.2% | 2.2% | 0.4% | -4.5% |
| Manufacturing | 0.5% | 0.3% | -0.8% | -1.3% | -1.8% | -6.1% |

Tom Moeller
AuthorMore in Author Profile »Prior to joining Haver Analytics in 2000, Mr. Moeller worked as the Economist at Chancellor Capital Management from 1985 to 1999. There, he developed comprehensive economic forecasts and interpreted economic data for equity and fixed income portfolio managers. Also at Chancellor, Mr. Moeller worked as an equity analyst and was responsible for researching and rating companies in the economically sensitive automobile and housing industries for investment in Chancellor’s equity portfolio. Prior to joining Chancellor, Mr. Moeller was an Economist at Citibank from 1979 to 1984. He also analyzed pricing behavior in the metals industry for the Council on Wage and Price Stability in Washington, D.C. In 1999, Mr. Moeller received the award for most accurate forecast from the Forecasters' Club of New York. From 1990 to 1992 he was President of the New York Association for Business Economists. Mr. Moeller earned an M.B.A. in Finance from Fordham University, where he graduated in 1987. He holds a Bachelor of Arts in Economics from George Washington University.
More Economy in Brief


