 Global| Mar 13 2007
U.S. Retail Sales Pose a Dilemma
Summary
With flat January retail sales and a 0.1% overall rise in February, retail sales have little lift in Q1. The February retail sales report, with no revisions to the main headlines over the past two months - an unusual development, [...]
With flat January retail sales and a 0.1% overall rise in February, retail sales have little lift in Q1. The February retail sales report, with no revisions to the main headlines over the past two months - an unusual development, leaves us with two months of a very flat consumer. This in turn raises questions about growth in the economy at large since it has been banking on continued consumer strength.
With the huge drop in durable goods orders the outlook for capital spending is poor. Housing started off the quarter looking good but has since beaten a deep retreat. With GDP= C+I+G+(X-M) the question is: where is growth coming from? Take “C” for example, consumption: the retail sales portion is flat for two months running. Services spending, the half of consumption that always slips in under the radar, is probably still firm. But the “I,” for investment has three weak prongs: Business fixed investment is weak if capital goods orders are to be believed; inventories have been pared back (they are up slightly in January); residential investment is that well known story of the ongoing lethargy in housing or worse. Government is usually a GDP positive but is plodding. The X-M portion of GDP (called net exports, or the GDP version of the current account in real terms) has provided some stabilization to GDP growth since imports (M) have been weak due to weak domestic demand and exports have held up as foreign growth has been firm. That combination produces a push to GDP; since imports are a subtraction and weak imports aid US GDP growth. But it’s clear that the economy will not grow for long on its international portion alone. While CEOs at the Round table last week expressed a desire for more capital spending, what we have in hand are weak trends. And that puts more of the focus back onto the consumer.
Q1 Consumption Arithmetic. Fortunately Q4 growth was ‘back-loaded,’ exporting momentum to Q1. Here’s how that works. Since GDP is a quarterly variable we look at its components by quarter and play the game, ‘what have you done for me lately?’ also known as ‘what will GDP be this quarter?’ What matters for each component is its average for the quarter. Since consumer spending spiked at the end of Q4, it left a high level of spending in December 2006. Thus even with next to no growth in January and February the level of spending in February is still 4.5% above the Q4 average. So overall nominal retail sales are up at a 4.5% nominal pace in 2007-Q1 as a result of the high pace of growth in December of 2006. But that crutch is becoming overused with the February weakness.
Cold weather did sucker-punch housing this months so we have a basis for believing there was a noticeable adverse weather effect in play. On top of that, as we know, housing is being battered by an ongoing retrenchment. We see both of these factors at work in the retail sales report in building materials where sales plunged by 1.4% in February alone. Sales also fell sharply for furniture and electronic goods. Motor vehicles sales were, however, strong with a rise of 1.0%.
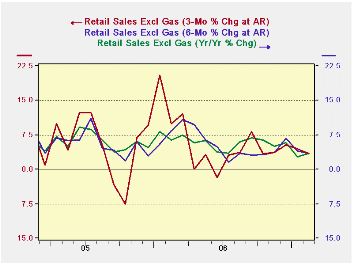
Nondurables limped to a gain of 0.1% in February and were actually weaker excluding gas station sales that jumped by 1.2% (-0.1% for retail non-durables sales excluding gas station sales).
With the contribution in from the December sales spurt still in play, 3-mo sales trends are still reasonably firm (saar growth of 4.9%). But if monthly sales do not perk up soon the December effect will cease to help and retailing will then appear to be faltering. Come March, December’s gain will play against three month growth since we will then be measuring growth from the elevated December base and December’s strength will play against us - so far we have no lift from that point on.
Still, a sag in the winter months is not decisive. December sales were very strong, leaving fewer goods to clear out in January and February. February is a short month with myriad holidays leaving a lot of the work to be done by seasonal factors. Complicating this is the cold snap in March. Winter this year has been backloaded. March has come in less like lion than like a Polar Bear, let hope by month’s end we do not have bi-polar bear.
All this complicates getting a good look at how the economy is really doing. To be sure with business investment surprisingly weak, a pick up from the consumer is essential or the economy bears are going make another run for the money. It sure complicates the Fed’s job especially with poor trends in productivity, labor costs and labor compensation. For now we can only watch and wait and hope that the slow growth is a product of bad weather.
| M/M | Seasonally Adjusted Annual Rate|||||
|---|---|---|---|---|---|
| Feb 2007 | 3-month | 6-month | Yr/Yr | Yr Ago: Y/Y | |
| Retail Sales & Food Services | 0.1% | 4.9% | 1.6% | 3.2% | 7.5% |
| Excluding MV & Parts | -0.1% | 4.9% | 0.7% | 3.1% | 9.4% |
| Excluding MV & Parts & Gas | -0.3% | 3.0% | 3.0% | 3.4% | 8.4% |
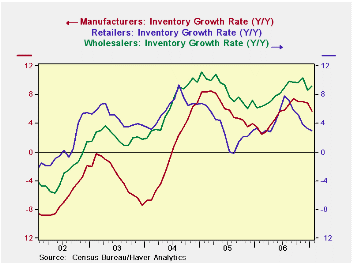 Inventories rose by a small amount in January 2007. The monthly rise of 0.2% was mostly accounted for by a sharp increase in wholesale inventories that rose by 0.7%. Retail inventories rose by 0.2% and manufacturing inventories fell by 0.2%. Inventories rose by a small amount in January 2007. The monthly rise of 0.2% was mostly accounted for by a sharp increase in wholesale inventories that rose by 0.7%. Retail inventories rose by 0.2% and manufacturing inventories fell by 0.2%.The first thing we see in inventory trends is that inventories have stopped the increase in their rate of growth. Inventories are still growing. But Yr/Yr growth rates have either stabilized or declined. For wholesalers the pace seems to have declined, whereas for manufacturers and retailers the pace of growth has been cut. This is largely because sales have slowed (see next chart). 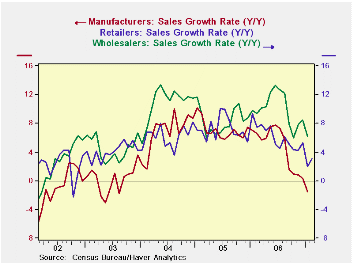 In this chart we see Yr/Yr growth plots of sales by sector. Sales growth rates are sliding across all sectors but the slide has halted for wholesalers, who also have stopped cutting their growth rate for inventories, as we saw above.Adequacy of inventory growth. To assess inventories I like to look at a growth rates for inventories Vs sales. I will show some of the more conventional I:S ratios for retailing later, but as an overview the growth rates when paired are important way to get a fix on what is going on with the dynamic interplay between inventories and sales. I:S ratios only show a relationship that is static. While we can compare the static ratios of today to past static relationships it does not give any idea how inventories are shifting relative to sales. The chart above does that. It looks at different time horizons comparing by sectors inventory growth rates to sales growth rates. And while (as we saw already) Yr/Yr growth rates show all inventory rates of growth reside above their respective sales rates of growth, over the three month horizon, sales growth exceeds inventory growth – as of January, at least. Over six-months, wholesale sales growth still exceeds wholesale inventory growth. And, while inventories in each sector outgrow sales Yr/Yr just a year before that (see table) the opposite was true. What this chart demonstrates is how the current inventory imbalance is probably minor. The Yr/Yr growth imbalances are worst for manufacturers where Yr/Yr sales are actually lower with inventories growing at 5.7% pace. And over the last three-months it is clear that –whatever the I:S ratio -- the imbalance between inventories and sales is being repaired by relatively faster sales growth across the board.  Retailing. Here we present just the I:S table for retail sectors. To the right we show the position of the I:S ratio in its own range of values over the past 5 years, expressing the current value as a percentile of the range. A value of 100% would be the greatest I:S ratio of the period while 0 % would be the weakest. The low percentile readings suggest that retailers are by and large ready to rebuild inventories. Clothing is an exception and autos are mid-range. Retailing. Here we present just the I:S table for retail sectors. To the right we show the position of the I:S ratio in its own range of values over the past 5 years, expressing the current value as a percentile of the range. A value of 100% would be the greatest I:S ratio of the period while 0 % would be the weakest. The low percentile readings suggest that retailers are by and large ready to rebuild inventories. Clothing is an exception and autos are mid-range. Supplement this chart with the dynamic retail growth chart on paired growth rates and we can be more constructive on the outlook… Supplement this chart with the dynamic retail growth chart on paired growth rates and we can be more constructive on the outlook…  The sector-paired growth rates show that for retailing in January, 3-month growth rates of sales generally exceed those for inventories. Over six months the trend is split. Over 12-months inventories are mostly growing faster, but not by large margins (clothing excepted). And again one year ago in January of 2006 sales outpaced inventories by a substantial margin across the board. That tells us the inventory overload is a recent and short term phenomenon.The question for inventories then is not ‘Are they lean enough to call for rebuilding?” Clearly they are. The real question is how retailers, wholesalers and manufacturers see sales prospects. The flat retail sales growth rates in January and February are a problem in that regard. If retailers judge the problem to be weather-related they may build stocks anyway. It’s their call. That’s why they get paid the Big Bucks. The sector-paired growth rates show that for retailing in January, 3-month growth rates of sales generally exceed those for inventories. Over six months the trend is split. Over 12-months inventories are mostly growing faster, but not by large margins (clothing excepted). And again one year ago in January of 2006 sales outpaced inventories by a substantial margin across the board. That tells us the inventory overload is a recent and short term phenomenon.The question for inventories then is not ‘Are they lean enough to call for rebuilding?” Clearly they are. The real question is how retailers, wholesalers and manufacturers see sales prospects. The flat retail sales growth rates in January and February are a problem in that regard. If retailers judge the problem to be weather-related they may build stocks anyway. It’s their call. That’s why they get paid the Big Bucks. |
by Robert A. Brusca March 13, 2007
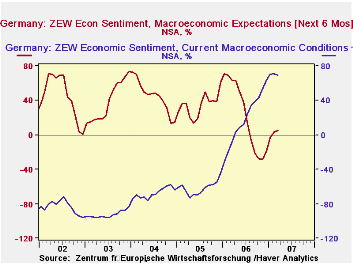
The ZEW Indicator of Economic Sentiment for Germany, which assesses the outlook in the next six months, based on the opinions of investors and analysts, rose 2.9 points in March to 5.8%. While the current level is a substantial improvement over the pessimism reached last November when pessimists exceeded optimists by 28.5%, it is well below the long term average of 33.2%. On the other hand, the fact that the participants became more positive during a survey period which included a sharp down turn in world stock markets and only a partial recovery, was in itself a pleasant surprise. Many observers had expected the indicator to decline.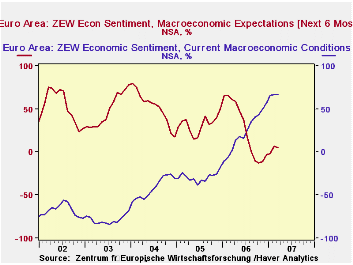
The assessment of current conditions declined slightly to 69.2% from 70.9%, the first decline since June 2005. The indicators for the outlook and current conditions are shown in the first chart.
The ZEW Financial Markets Survey also asks its participants to report on the outlook and current conditions in the entire Euro Area. The assessment of the outlook for the entire Euro Area declined in March 5.1% from 6.8% in February and the appraisal of current conditions rose marginally from 66.7% in February to 66.9% in March. The indicators of current conditions and the outlook for the Euro Area are shown in the second chart.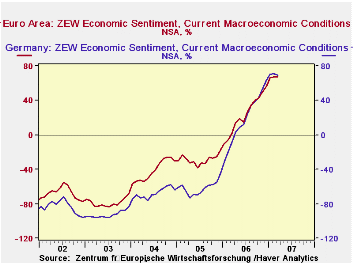
The indicators for the Euro Area, of course, include those for Germany, but the differences between the indicators of the Euro Area and those of Germany can shed some light on the performance of Germany relative to the rest of the Euro Area. From the appraisal of current conditions in the total area and in Germany, we can infer that the participants had rated conditions in the Euro Area outside of Germany higher than those in Germany until November, 2006. Since then, the appraisal of current conditions in Germany has been higher than that for the whole region, as can be seen in the third chart.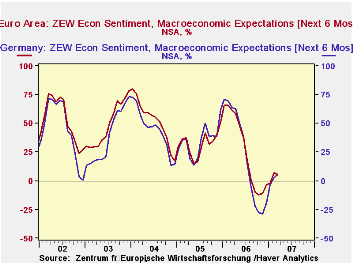 Similar inferences can be derived from the appraisals of the outlook in the two series. The outlook for Germany was less positive than that for the whole area indicator until about mid 2005 when it became more positive than the whole area indicator. It remained more positive from then until June 2006. After that until this March of this year, the German outlook for the German economy appeared to be much less positive than that for the Euro Area as a whole. The divergence may have been due, in part perhaps, to the prospect of the January 1, 2007 increase in Germany's VAT. Since the effects of the higher VAT appear to have been less onerous than expected, optimism in the German outlook has has become modestly more positive relative to the whole area, as can be seen in the fourth chart.
| ZEW INDICATORS (% Balance) | Mar 06 | Feb 06 | Mar 05 | M/M DIF | Y/Y DIF | 2006 | 2005 | 2004 |
|---|---|---|---|---|---|---|---|---|
| Germany | ||||||||
| Current Conditions | 69.2 | 70.9 | -8.4 | -1.7 | 77.6 | 18.3 | -61.8 | -67.7 |
| Expectations 6 Months Ahead | 5.8 | 2.9 | 63.4 | 2.9 | -47.6 | 22.3 | 34.8 | 44.6 |
| Eurostat | ||||||||
| Current Conditions | 66.9 | 66.7 | 2.0 | 0.2 | 64.9 | 23.8 | -28.7 | -41.4 |
| Expectations 6 Months Ahead | 5.1 | 6.8 | 61.1 | -1.7 | -56.0 | 26.6 | 32.3 | 52.1 |

Robert Brusca
AuthorMore in Author Profile »Robert A. Brusca is Chief Economist of Fact and Opinion Economics, a consulting firm he founded in Manhattan. He has been an economist on Wall Street for over 25 years. He has visited central banking and large institutional clients in over 30 countries in his career as an economist. Mr. Brusca was a Divisional Research Chief at the Federal Reserve Bank of NY (Chief of the International Financial markets Division), a Fed Watcher at Irving Trust and Chief Economist at Nikko Securities International. He is widely quoted and appears in various media. Mr. Brusca holds an MA and Ph.D. in economics from Michigan State University and a BA in Economics from the University of Michigan. His research pursues his strong interests in non aligned policy economics as well as international economics. FAO Economics’ research targets investors to assist them in making better investment decisions in stocks, bonds and in a variety of international assets. The company does not manage money and has no conflicts in giving economic advice.
More Economy in Brief


