Global| Dec 11 2014
U.S. Retail Sales Improvement Led by Autos
by:Tom Moeller
|in:Economy in Brief
Summary
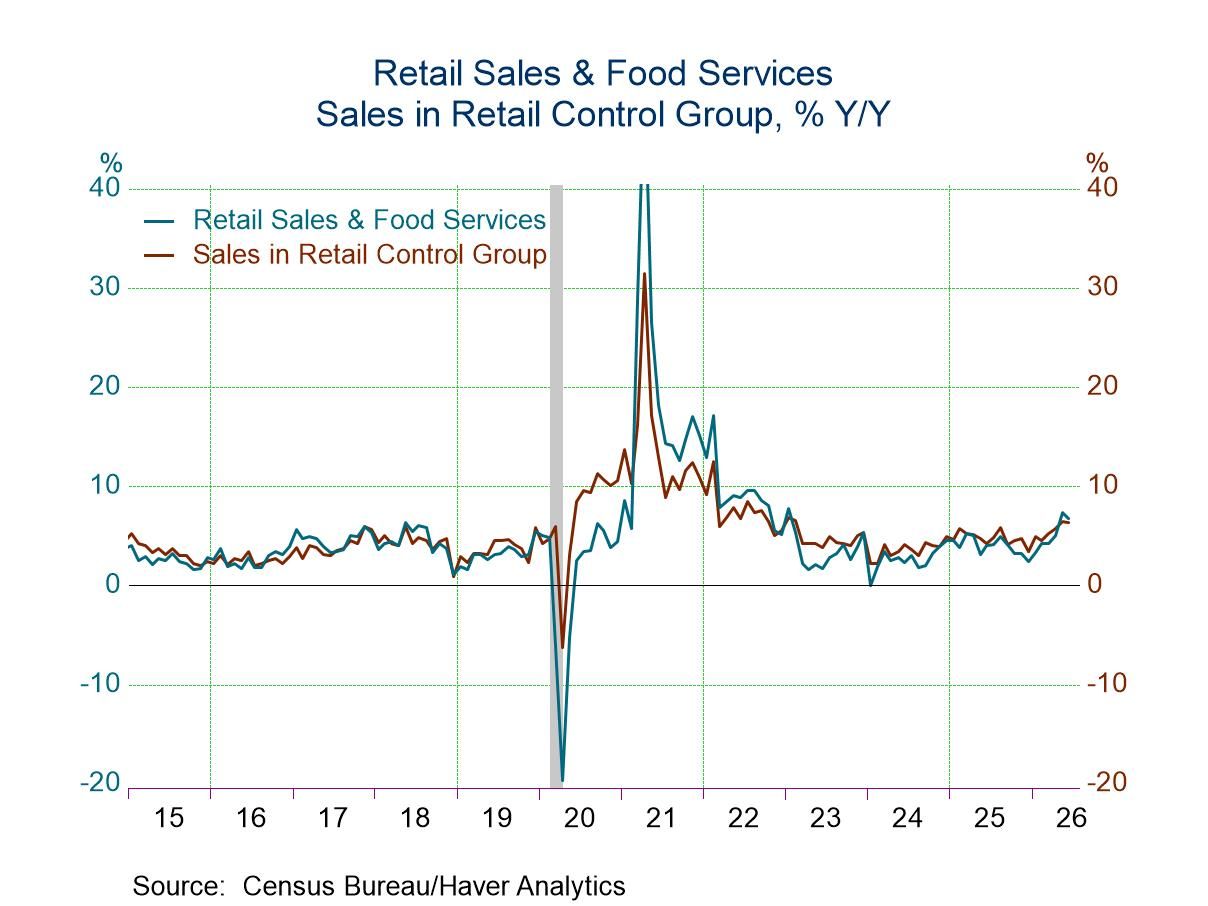
Overall retail sales including food services increased 0.7% during November following a 0.5% October gain, revised from 0.3%. A 0.4% rise had been expected in the Action Economics Forecast Survey. Sales excluding autos rose 0.5% (4.3% [...]


Overall retail sales including food services increased 0.7% during November following a 0.5% October gain, revised from 0.3%. A 0.4% rise had been expected in the Action Economics Forecast Survey. Sales excluding autos rose 0.5% (4.3% y/y) following a 0.4% gain, revised from 0.3%. A 0.1% uptick had been expected. During the last ten years, there has been a 58% correlation between the y/y change in retail sales and the change in disposable personal income.
Higher motor vehicle sales led last month's total increase with a 1.7% gain (8.6% y/y) on the heels of a 0.8% rise. The latest gain reflected a 4.5% rise (5.6% y/y) in unit sales. Building materials & garden equipment purchases rose 1.4% (7.8% y/y) after a 0.4% improvement while clothing store sales jumped 1.2% (3.6% y/y), double the prior month's increase. Purchases from nonstore retailers increased 1.0% (8.7% y/y) after a 1.6% rise. Sales of electronics & home furnishings gained 0.9% (6.8% y/y) and made up the prior month's decline while furniture sales improved 0.5% (2.1% y/y) following a 0.7% rise. Sales at general merchandise stores gained 0.5% (2.6% y/y) after a 0.1% uptick while sporting goods store sales rose 0.3% (3.2% y/y) after a 1.8% jump. Gasoline service station sales declined 0.8% (-2.1% y/y) with lower prices following a 1.3% fall. Sales at eating & drinking establishments rose 0.7% (6.7% y/y), half the prior month's increase.
In the nondiscretionary spending categories, sales at health & personal care stores gained 0.8% (6.8% y/y) following four months of near 0.3% increase. Food & beverage stores gained 0.3% (4.1% y/y) after a 0.2% rise.
The retail sales figures are available in Haver's USECON database. The Action Economics figures are in the AS1REPNA database.
Implied Taylor Rules among Forecasters from the Federal Reserve Bank of Cleveland is available here.


| Retail Spending (%) | Nov | Oct | Sep | Nov Y/Y | 2013 | 2012 | 2011 |
|---|---|---|---|---|---|---|---|
| Total Retail Sales & Food Services | 0.7 | 0.5 | -0.1 | 5.1 | 4.2 | 5.1 | 7.5 |
| Excluding Autos | 0.5 | 0.4 | 0.1 | 4.3 | 3.0 | 4.2 | 6.9 |
| Non-Auto Less Gasoline & Building Supplies | 0.6 | 0.7 | 0.3 | 4.8 | 3.2 | 4.0 | 5.4 |
| Retail Sales | 0.7 | 0.4 | -0.2 | 4.9 | 4.3 | 5.0 | 7.6 |
| Motor Vehicle & Parts | 1.7 | 0.8 | -0.7 | 8.6 | 9.3 | 9.1 | 9.9 |
| Retail Less Autos | 0.4 | 0.3 | -0.1 | 3.9 | 3.0 | 4.0 | 7.1 |
| Gasoline Stations | -0.8 | -1.3 | -0.8 | -2.1 | -0.4 | 4.2 | 18.3 |
| Food Service & Drinking Places Sales | 0.7 | 1.4 | 1.0 | 6.7 | 3.0 | 5.9 | 6.0 |

Tom Moeller
AuthorMore in Author Profile »Prior to joining Haver Analytics in 2000, Mr. Moeller worked as the Economist at Chancellor Capital Management from 1985 to 1999. There, he developed comprehensive economic forecasts and interpreted economic data for equity and fixed income portfolio managers. Also at Chancellor, Mr. Moeller worked as an equity analyst and was responsible for researching and rating companies in the economically sensitive automobile and housing industries for investment in Chancellor’s equity portfolio. Prior to joining Chancellor, Mr. Moeller was an Economist at Citibank from 1979 to 1984. He also analyzed pricing behavior in the metals industry for the Council on Wage and Price Stability in Washington, D.C. In 1999, Mr. Moeller received the award for most accurate forecast from the Forecasters' Club of New York. From 1990 to 1992 he was President of the New York Association for Business Economists. Mr. Moeller earned an M.B.A. in Finance from Fordham University, where he graduated in 1987. He holds a Bachelor of Arts in Economics from George Washington University.
More Economy in Brief