 Global| May 07 2020
U.S. Productivity Declines; Unit Labor Costs Surge in Q1'20
by:Tom Moeller
|in:Economy in Brief
Summary
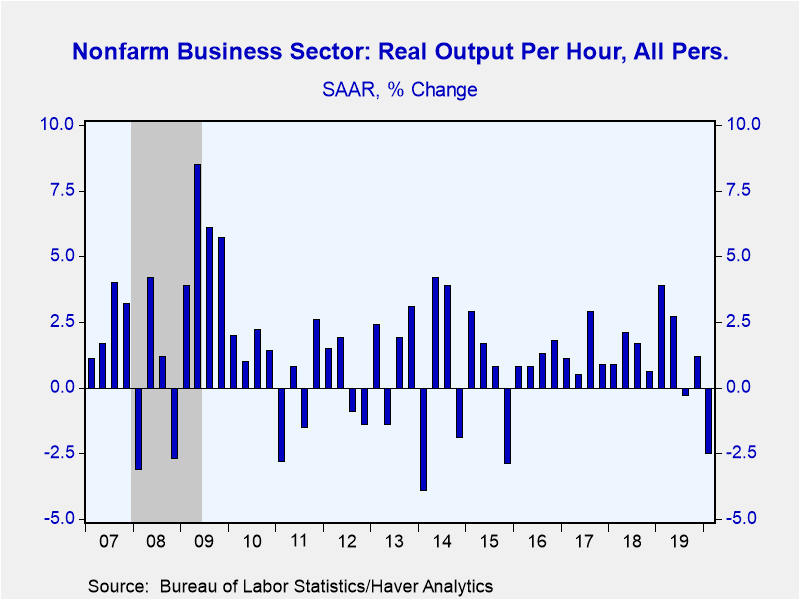
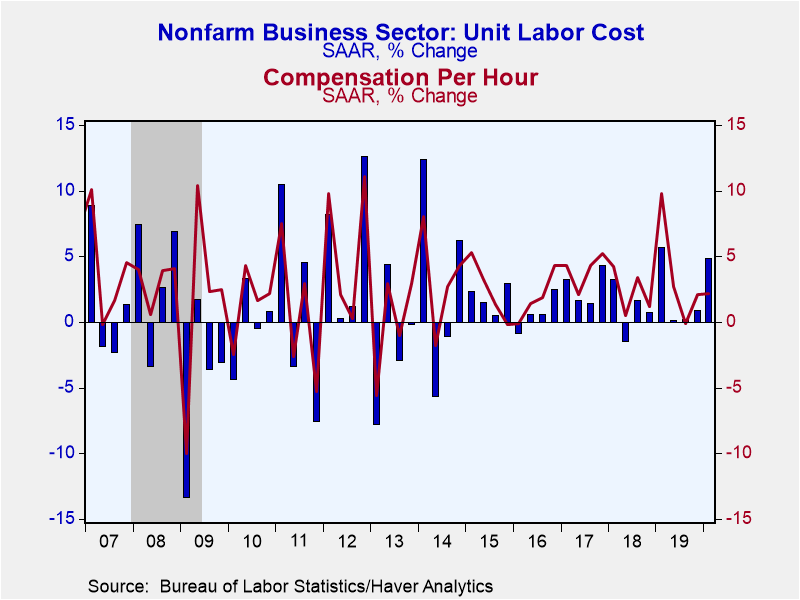
• Output per hour fell as recessionary forces emerge. • Unit labor costs rise and set one-year high. Productivity in the nonfarm business sector during Q1'20 fell 2.5% (SAAR) after an unchanged 1.2% Q4'19 rise. A 5.2% decline had been [...]
• Output per hour fell as recessionary forces emerge.
• Unit labor costs rise and set one-year high.
Productivity in the nonfarm business sector during Q1'20 fell 2.5% (SAAR) after an unchanged 1.2% Q4'19 rise. A 5.2% decline had been expected in the Action Economics Forecast Survey. The decline lowered the y/y rise in productivity to 0.3%, its weakest gain since a slight decline in Q3'16. Output was off 6.2% (+0.1% y/y) while hours-worked fell 3.8% (-0.2% y/y).
Compensation increased 2.2% (1.7% y/y). The gain followed a similar rise during Q3. Adjusted for price changes, compensation rose 0.9% (-0.4% y/y). Unit labor costs jumped 4.8% during Q1, the largest increase in four quarters. The gain left the y/y increase steady at 1.5%. A 2.1% rise had been expected.
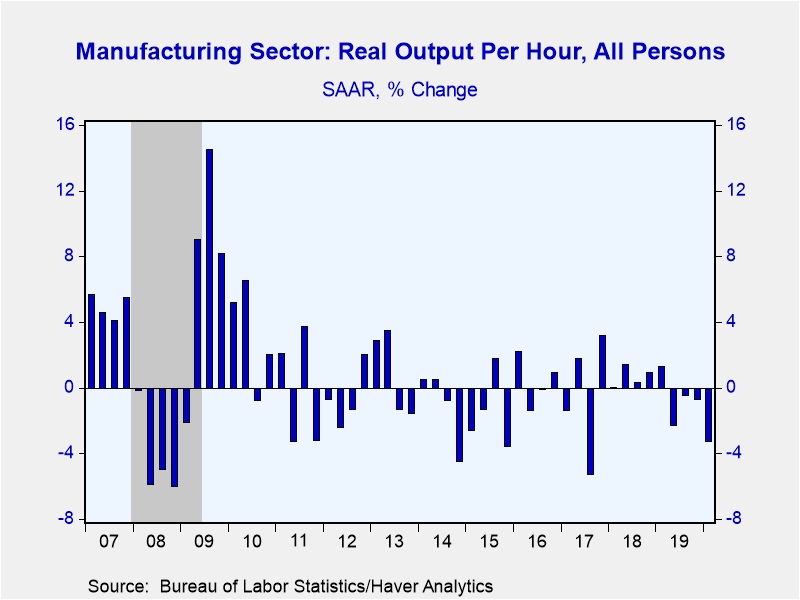
In the manufacturing sector, productivity declined at a 3.3% annual rate (-1.7% y/y), the largest of four consecutive quarterly shortfalls. Output weakened 7.1% (-2.4% y/y) while hours worked fell 3.9% (-0.7% y/y.
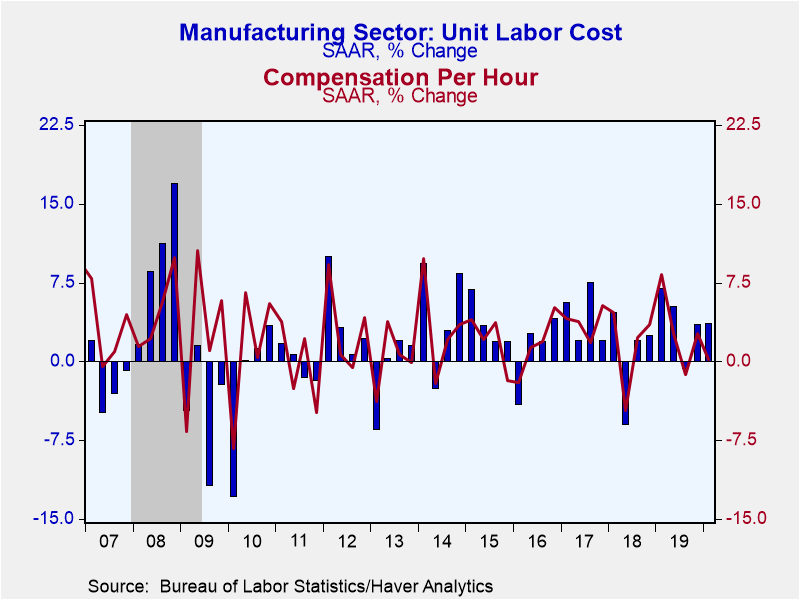
Compensation in the factory sector edged 0.2% higher (1.1% y/y). Adjusted for price inflation, compensation fell 1.0% both q/q and y/y. The compensation rise, combined with the shortfall in productivity, lifted unit labor costs in the factory sector by a 3.6% annual rate (2.9% y/y).
The productivity & cost figures are available in Haver's USECON database.
| Productivity & Costs (SAAR, %) | Q1'20 | Q4'19 | Q3'19 | Q1 Y/Y | 2019 | 2018 | 2017 |
|---|---|---|---|---|---|---|---|
| Nonfarm Business Sector | |||||||
| Output per Hour (Productivity) | -2.5 | 1.2 | -0.3 | 0.3 | 1.9 | 1.4 | 1.3 |
| Compensation per Hour | 2.2 | 2.1 | -0.1 | 1.7 | 3.7 | 3.3 | 3.5 |
| Unit Labor Costs | 4.8 | 0.9 | 0.2 | 1.5 | 1.7 | 1.8 | 2.1 |
| Manufacturing Sector | |||||||
| Output per Hour (Productivity) | -3.3 | -0.7 | -0.5 | -1.7 | 0.1 | 0.4 | -0.4 |
| Compensation per Hour | 0.2 | 2.7 | -1.2 | 1.1 | 3.2 | 2.2 | 3.6 |
| Unit Labor Costs | 3.6 | 3.5 | -0.7 | 2.9 | 3.1 | 1.8 | 4.0 |
Tom Moeller
AuthorMore in Author Profile »Prior to joining Haver Analytics in 2000, Mr. Moeller worked as the Economist at Chancellor Capital Management from 1985 to 1999. There, he developed comprehensive economic forecasts and interpreted economic data for equity and fixed income portfolio managers. Also at Chancellor, Mr. Moeller worked as an equity analyst and was responsible for researching and rating companies in the economically sensitive automobile and housing industries for investment in Chancellor’s equity portfolio. Prior to joining Chancellor, Mr. Moeller was an Economist at Citibank from 1979 to 1984. He also analyzed pricing behavior in the metals industry for the Council on Wage and Price Stability in Washington, D.C. In 1999, Mr. Moeller received the award for most accurate forecast from the Forecasters' Club of New York. From 1990 to 1992 he was President of the New York Association for Business Economists. Mr. Moeller earned an M.B.A. in Finance from Fordham University, where he graduated in 1987. He holds a Bachelor of Arts in Economics from George Washington University.


