 Global| Aug 18 2009
U.S. PPI Posts Broad-Based Decline With Energy Prices Leading The Fall
by:Tom Moeller
|in:Economy in Brief
Summary
Pricing power reflected the weakness in the U.S. economy last month as the PPI for finished goods fell 0.9%. That reversed half of the 1.8% jump during June and left prices down 6.4% from the year ago level. The decline also was [...]
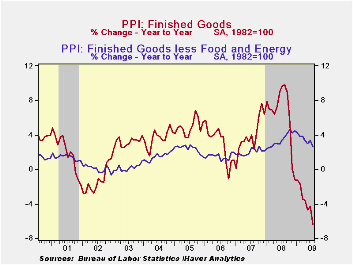 Pricing
power reflected the weakness in the U.S. economy last
month as the PPI for finished goods fell 0.9%. That reversed half of
the 1.8% jump during June and left prices down 6.4% from the year ago
level. The decline also was deeper than Consensus expectations for a
0.3% drop. In addition, a 0.1% decline in PPI less food &
energy contrasted with expectations for a 0.1% increase. That decline
pulled the y/y change to 2.6% which was the weakest increase since
early 2008.
Pricing
power reflected the weakness in the U.S. economy last
month as the PPI for finished goods fell 0.9%. That reversed half of
the 1.8% jump during June and left prices down 6.4% from the year ago
level. The decline also was deeper than Consensus expectations for a
0.3% drop. In addition, a 0.1% decline in PPI less food &
energy contrasted with expectations for a 0.1% increase. That decline
pulled the y/y change to 2.6% which was the weakest increase since
early 2008.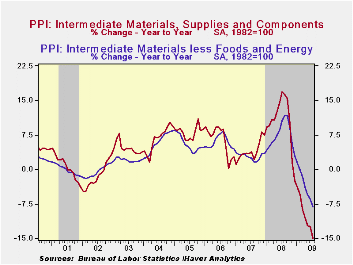
Lower energy prices led the decline in last month's PPI with a 2.4% drop (-29.6% y/y) after increases during the prior two months. The July decline was led by a 10.2% fall in gasoline prices (-45.1% y/y) which reversed most of the increase during June. Working the other way, natural gas prices firmed again last month and posted a 3.3% (-30.9% y/y) increase.
The PPI for finished consumer goods less food & energy fell by 0.1% (+3.1% y/y) after a firm 0.5% jump during June. Finished durables prices reversed most of the June gain with a 0.5% decline (+2.7% y/y). Posting a moderate increase were prices of core finished nondurable goods. They gained 0.4% and the y/y increase of 3.5% is off from the 5.9% rise as of the end of last year. Capital equipment prices also reflected the weakness in demand and fell 0.2%. That pulled the y/y increase to 1.9% after a 4.3% rise as of last December.
 Prices for intermediate goods ticked 0.2% lower led by a 2.0%
decline in food prices (-15.0% y/y). That decline was in addition to a
1.4% drop (-34.5% y/y) in energy prices. Less food & energy,
intermediate goods prices ticked 0.2% higher for only the second
increase since last September.
Prices for intermediate goods ticked 0.2% lower led by a 2.0%
decline in food prices (-15.0% y/y). That decline was in addition to a
1.4% drop (-34.5% y/y) in energy prices. Less food & energy,
intermediate goods prices ticked 0.2% higher for only the second
increase since last September.
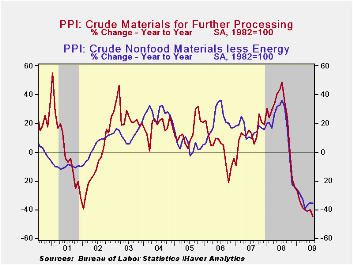
The crude materials PPI reversed all of its June increase with a 4.5% decline. That was led by a 6.1% (-25.7% y/y) drop in food prices and a 6.2% decline in crude energy prices (-59.6% y/y). Core pricing power at the crude level improved for the third straight month and posted a 2.9% increase.
The producer price data is available in Haver's USECON database. More detailed data is in the PPI and in the PPIR databases.
| Producer Price Index (%) | July | June | Y/Y | 2008 | 2007 | 2006 |
|---|---|---|---|---|---|---|
| Finished Goods | -0.9 | 1.8 | -6.4 | 6.4 | 3.9 | 2.9 |
| Core | -0.1 | 0.5 | 2.6 | 3.4 | 2.0 | 1.5 |
| Intermediate Goods | -0.2 | 1.9 | -15.0 | 10.5 | 4.0 | 6.4 |
| Core | 0.2 | 0.4 | -8.2 | 7.4 | 2.8 | 6.0 |
| Crude Goods | -4.5 | 4.6 | -45.0 | 21.4 | 11.9 | 1.4 |
| Core | 2.9 | 2.6 | -35.7 | 14.8 | 15.6 | 20.8 |
by Tom Moeller August 18, 2009
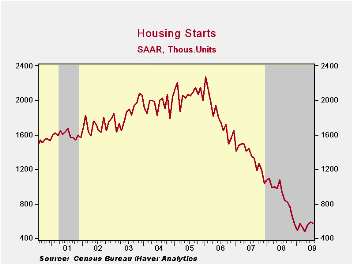
After two months of fairly strong increases, the momentum in the housing sector paused last month. Housing starts dipped to 581,000 (AR) units versus 587,000 during June, a level which was revised up slightly from the initial report. The latest figure fell somewhat short of Consensus expectations for 600,000 starts.
Despite the overall decline, starts of single-family homes
rose 1.7% for the fifth straight month. The gains pushed the series
37.3% off the record low which dates back to 1959. During
the last ten years, there has been an 84% correlation between the q/q
change in single-family starts and their contribution to quarterly GDP
growth.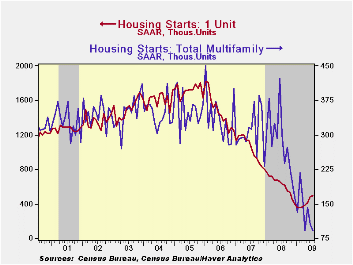
Starts of multi-family homes fell hard again to 91,000 which was the record low for the series. Starts of apartments, condominiums & town houses remained down by roughly two-thirds from the 2006 peak.
By region starts of single-family units last month were mixed across the country. Single-family starts in the Northeast rose 14.0% to their highest level since October (-16.2% y/y). Starts in the West ticked up 1.9% for the fifth straight month of increase (-23.6% y/y) and in the South single-family starts also ticked up by 0.8% (-23.4% y/y). In the Midwest starts fell a modest 3.4% (-22.2% y/y) after five consecutive months of increase.
Overall, building permits fell 1.8% and gave back a piece of their 10.0% jump during June. Permits remained just above the record low and permits were down by roughly one-half from last May. As with starts, recent gains in building permits have been led by the single-family sector, a leading indicator of starts. During July, permits rose for the fourth straight month and were up 23.8% since December (-20.3% y/y).
The housing starts figures can be found in Haver's USECON database.
Examining the Housing Crisis by Home Price Tier from the Federal Reserve Bank of St. Louis can be found here.
| Housing Starts (000s, SAAR) | July | June | Y/Y | 2008 | 2007 | 2006 |
|---|---|---|---|---|---|---|
| Total | 581 | 587 | -37.7% | 900 | 1,342 | 1,812 |
| Single-Family | 490 | 482 | -22.5 | 616 | 1,036 | 1,474 |
| Multi-Family | 91 | 105 | -69.8 | 285 | 306 | 338 |
| Building Permits | 560 | 570 | -39.4 | 895 | 1,392 | 1,844 |
by Tom Moeller August 18, 2009
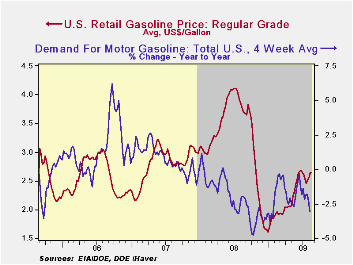
The strong rise this year in gasoline prices stabilized last week. The pump price for regular gasoline held at an average $2.64 per gallon and that was down a nickel from last month's high. Despite this w/w stability, however, prices remain roughly one dollar (59%) higher versus the December low. Yesterday, the cash market price for gasoline of $1.87 was down from last week and down from the $1.99 averaged the week earlier. Nevertheless, gasoline prices were up off the early-July low of $1.60. The figures are reported by the U.S. Department of Energy and can be found in Haver's WEEKLY & DAILY databases.
Crude oil prices also are slightly off
their high. Light sweet crude oil prices (WTI) dipped last week to
$69.65 per barrel but they've roughly doubled this year. Yesterday the
spot market price for light sweet crude oil fell back again, to $66.75
per barrel. Prices had reached a daily high of $72.68 earlier in July.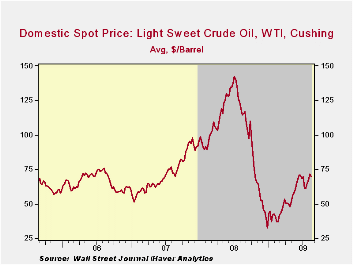
Of late, the demand for gasoline hit a plateau after an earlier seasonal run-up. During the last four weeks since May, the demand for gasoline has moved sideways and is down by 3.1% y/y. Though that compares to a nearly 5% rate of decline last fall, the relative strength is diminishing. Demand for distillate also is off a sharp 20.7% though residual fuel oil demand has moved higher. Finally, oil remains plentiful as evidenced by a 14.1% y/y rise in inventories of crude oil & petroleum products. Inventories of gasoline recently have firmed by 4.5% y/y and crude oil inventories less the SPR are up by 18.7%. The figures on crude oil production and inventories are available in Haver's OILWKLY database.
Natural gas prices continued their move sideways last week. At an average of $3.44 per mmbtu (-62.8% y/y), the price was down by three-quarters from the high reached in early-July of last year of $13.19/mmbtu.
| Weekly Prices | 08/17/09 | 08/10/09 | Y/Y | 2008 | 2007 | 2006 |
|---|---|---|---|---|---|---|
| Retail Regular Gasoline ($ per Gallon, Regular) | 2.64 | 2.65 | -29.5% | 3.25 | 2.80 | 2.57 |
| Light Sweet Crude Oil, WTI ($ per bbl.) | 69.65 | 71.57 | -39.1% | 100.16 | 72.25 | 66.12 |
by Louise Curley August 18, 2009
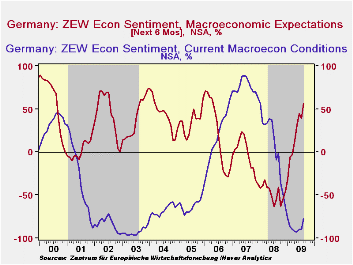
The participants in the ZEW survey--institutional investors
and analysts--have become much more positive about the outlook, six
months ahead. The ZEW Economic Sentiment indicator increased 16.6
points in August to reach a percent balance of 56.1, the highest since
April 2006 and well above the long term average of 26.5. At the same
time the appraisal of the current economic condition was somewhat  less
negative. The excess of pessimists regarding the current economic
situation was 77.2% compared with 89.3% in July. The two indicators are
shown in the first chart.
less
negative. The excess of pessimists regarding the current economic
situation was 77.2% compared with 89.3% in July. The two indicators are
shown in the first chart.
Recent data showing improvements in orders, production,
exports and an increase in Germany's second quarter GDP, no doubt,
influenced the improvement in both the appraisal of the current
situation and of the outlook.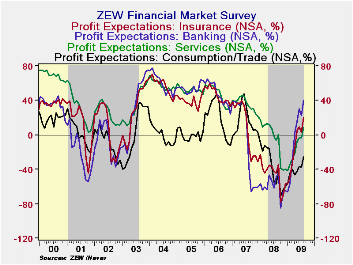 The continued high negative balance of
opinion regarding the current situation could suggest that the
financial community has yet to be convinced that recovery is underway,
but their positive view of the future suggests otherwise. (Opinions are
influenced by current economic conditions and opinions, through their
impact on "animal spirits" influence future economic conditions.)
The continued high negative balance of
opinion regarding the current situation could suggest that the
financial community has yet to be convinced that recovery is underway,
but their positive view of the future suggests otherwise. (Opinions are
influenced by current economic conditions and opinions, through their
impact on "animal spirits" influence future economic conditions.)
| ZEW | Aug 09 | Jul 09 | Aug 08 | M/M chg | Y/Y chg | 2008 | 2007 | 2006 |
|---|---|---|---|---|---|---|---|---|
| Current Economic Situation (% balance) | -77.2 | -89.3 | -9.2 | 12.1 | -68.0 | 7.3 | 75.9 | 18.3 |
| Economic Expectation (% balance) | 56.1 | 39.5 | -55.5 | 16.6 | 111.6 | -47.5 | -3.0 | 22.3 |

Tom Moeller
AuthorMore in Author Profile »Prior to joining Haver Analytics in 2000, Mr. Moeller worked as the Economist at Chancellor Capital Management from 1985 to 1999. There, he developed comprehensive economic forecasts and interpreted economic data for equity and fixed income portfolio managers. Also at Chancellor, Mr. Moeller worked as an equity analyst and was responsible for researching and rating companies in the economically sensitive automobile and housing industries for investment in Chancellor’s equity portfolio. Prior to joining Chancellor, Mr. Moeller was an Economist at Citibank from 1979 to 1984. He also analyzed pricing behavior in the metals industry for the Council on Wage and Price Stability in Washington, D.C. In 1999, Mr. Moeller received the award for most accurate forecast from the Forecasters' Club of New York. From 1990 to 1992 he was President of the New York Association for Business Economists. Mr. Moeller earned an M.B.A. in Finance from Fordham University, where he graduated in 1987. He holds a Bachelor of Arts in Economics from George Washington University.
More Economy in Brief


