 Global| Jul 14 2009
U.S. PPI Jumps With Higher Gasoline Prices; Core Prices Firm As Well
by:Tom Moeller
|in:Economy in Brief
Summary
The economic recession may be restraining pricing power generally, but not last month. The PPI for finished goods jumped 1.8% after a 0.2% uptick during May. Consensus expectations had been for a 0.9% increase. The real news, however, [...]
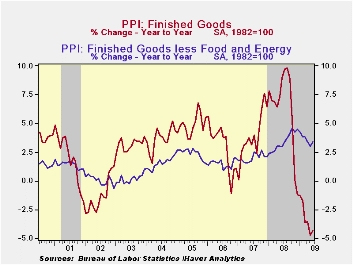
The economic recession may be restraining pricing power generally, but not last month. The PPI for finished goods jumped 1.8% after a 0.2% uptick during May. Consensus expectations had been for a 0.9% increase. The real news, however, was that some of this pricing strength bled over and raised core pricing power. The PPI less food & energy rose 0.5%, the strongest gain since October.
Higher energy prices, up 6.6% m/m, led the strength in last
month's PPI. The rise did not, however, recoup much of energy's earlier
weakness so y/y prices were still down by one quarter. The June gain
was led by an 18.5% pop in gasoline prices but they were still off
37.9% y/y. Natural gas prices also were firm last month and rose 2.5%
(-27.1% y/y).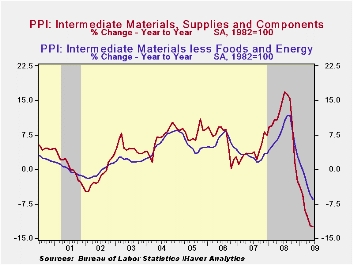
The PPI for finished consumer goods less food & energy was strong and posted a 0.5% (3.8% y/y) gain. It was the strongest increase since October and was led by a 0.9% (3.5% y/y) gain in durables prices. Core nondurable price gains have been weakening, however, and were up just 0.1%. The y/y gain of 3.9% is off its peak of 5.9% reached last fall. Capital equipment prices also firmed by 0.5% (2.7% y/y) after five months during which they were unchanged.
Prices for intermediate goods also moved higher by 1.9% due to
higher energy prices. Food prices also were firm for the third straight
month. Less food & energy, intermediate goods prices posted the
first increase since last September. Nevertheless, the 0.4% rise left
core prices down a record 6.5% y/y.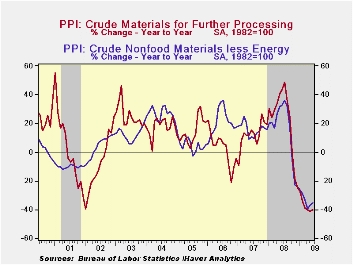
The crude materials PPI rose for a third month led by a 10.9% rise in crude energy prices. Despite this increase, however, crude energy prices remained down by more than one-half from the year ago level. Finished food prices reversed their May increase. They fell 0.4% and the decline left them down by 20.9% from last year. Core pricing power at the crude level also improved and posted a 2.6% increase. That was the third consecutive monthly increase and further indicative of improvement in factory sector activity.
The Producer Price Index data is available in Haver's USECON database. More detailed data is in the PPI and in the PPIR databases.
| Producer Price Index (%) | June | May | Y/Y | 2008 | 2007 | 2006 |
|---|---|---|---|---|---|---|
| Finished Goods | 1.8 | 0.2 | -4.3 | 6.4 | 3.9 | 2.9 |
| Core | 0.5 | -0.1 | 3.4 | 3.4 | 2.0 | 1.5 |
| Intermediate Goods | 1.9 | 0.3 | -12.4 | 10.5 | 4.0 | 6.4 |
| Core | 0.4 | -0.2 | -6.5 | 7.4 | 2.8 | 6.0 |
| Crude Goods | 4.6 | 3.6 | -40.2 | 21.4 | 11.9 | 1.4 |
| Core | 2.6 | 6.7 | -35.4 | 14.8 | 15.6 | 20.8 |

Tom Moeller
AuthorMore in Author Profile »Prior to joining Haver Analytics in 2000, Mr. Moeller worked as the Economist at Chancellor Capital Management from 1985 to 1999. There, he developed comprehensive economic forecasts and interpreted economic data for equity and fixed income portfolio managers. Also at Chancellor, Mr. Moeller worked as an equity analyst and was responsible for researching and rating companies in the economically sensitive automobile and housing industries for investment in Chancellor’s equity portfolio. Prior to joining Chancellor, Mr. Moeller was an Economist at Citibank from 1979 to 1984. He also analyzed pricing behavior in the metals industry for the Council on Wage and Price Stability in Washington, D.C. In 1999, Mr. Moeller received the award for most accurate forecast from the Forecasters' Club of New York. From 1990 to 1992 he was President of the New York Association for Business Economists. Mr. Moeller earned an M.B.A. in Finance from Fordham University, where he graduated in 1987. He holds a Bachelor of Arts in Economics from George Washington University.
More Economy in Brief


