 Global| Feb 19 2009
U.S. PPI Firmer Than Expected
by:Tom Moeller
|in:Economy in Brief
Summary
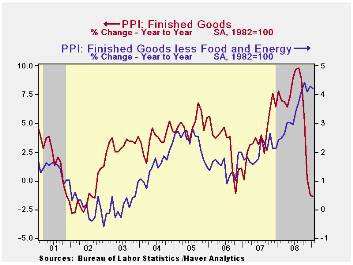
U.S. producer prices for finished goods rose 0.8% during January following five consecutive months of sharp decline. Despite the latest monthly increase, however, the year-to-year change of -1.3% was the softest since late 2002. A [...]
 U.S.
producer prices for finished goods rose 0.8% during January following
five consecutive months of sharp decline. Despite the latest monthly
increase, however, the year-to-year change of -1.3% was the softest
since late 2002.
U.S.
producer prices for finished goods rose 0.8% during January following
five consecutive months of sharp decline. Despite the latest monthly
increase, however, the year-to-year change of -1.3% was the softest
since late 2002.
A 3.7% rise (-19.2% y/y) in finished energy prices was responsible for much of the lift to the January PPI. It reversed some of a 9.1% December drop. The increase was the first rise in energy costs in six months and was led by a 15.3% pop (-45.0% y/y) in gasoline prices. Home heating oil prices rose a lesser 1.6% (-41.7% y/y) but natural gas prices fell 1.5% (+4.5% y/y).
Lower finished food prices offset some of the upward lift from energy costs. The 0.4% January decline lowered the year-to-year increase to 2.0% from its high of 9.1% this past summer. The moderation in food price inflation occurred because of a 6.2% annual rate of decline in overall food prices during the last three months. The drop was led by lower meat, vegetable and dairy product costs.
 Less food & energy, prices were strong
last month. The 0.4% increase in PPI less food and fuels was double
expectations and followed two months of 0.1% and 0.2% gain.
Year-to-year the gains have been firm, stable (above 4.0% since
September) and apparently insensitive to the economic
downturn. Prices of core finished consumer goods rose 0.4%
last month and the annual rate of gain was 4.2%. Durable consumer goods
prices also jumped 0.4% in January and were up 3.1% y/y.
Appliance prices surged 3.9% y/y, nearly their strongest since 1989,
while core nondurable goods prices strengthened to a 5.4% y/y increase,
also near the fastest rise since early 1999. In addition,
prices for capital equipment firmed and rose 4.0%, again the strongest
since 1989.
Less food & energy, prices were strong
last month. The 0.4% increase in PPI less food and fuels was double
expectations and followed two months of 0.1% and 0.2% gain.
Year-to-year the gains have been firm, stable (above 4.0% since
September) and apparently insensitive to the economic
downturn. Prices of core finished consumer goods rose 0.4%
last month and the annual rate of gain was 4.2%. Durable consumer goods
prices also jumped 0.4% in January and were up 3.1% y/y.
Appliance prices surged 3.9% y/y, nearly their strongest since 1989,
while core nondurable goods prices strengthened to a 5.4% y/y increase,
also near the fastest rise since early 1999. In addition,
prices for capital equipment firmed and rose 4.0%, again the strongest
since 1989.
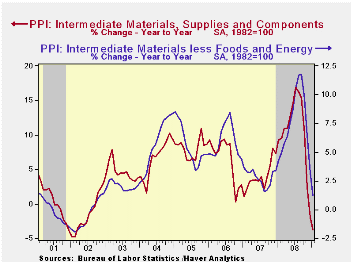
As was the case last month, lower prices for intermediate goods may portend softer gains in finished goods prices coming down the pike. Intermediate goods prices fell 0.7% during January and are down 3.7% year-to-year, the weakest since 2002. Excluding food & energy, prices fell for the fourth consecutive month and the 1.1% drop left the year-to-year change at 1.2%. Core prices increased 7.6% during all of last year.
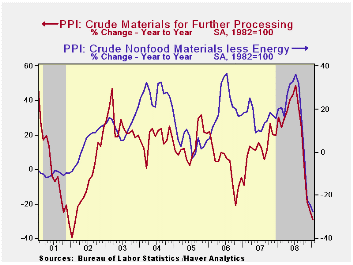 The
crude materials PPI fell for the sixth straight month and is the most
sensitive to current weakness in the economy. The 2.9% decline in the
total was led by an 8.1% drop (-39.8% y/y) in energy
prices. Crude food prices did rise by 1.0% last month but
year-to-year they fell 15.5%. Less food & energy, January crude
prices ticked higher by 0.1% following five months of sharp decline.
The
crude materials PPI fell for the sixth straight month and is the most
sensitive to current weakness in the economy. The 2.9% decline in the
total was led by an 8.1% drop (-39.8% y/y) in energy
prices. Crude food prices did rise by 1.0% last month but
year-to-year they fell 15.5%. Less food & energy, January crude
prices ticked higher by 0.1% following five months of sharp decline.
The Producer Price Index data is available in Haver's USECON database. More detailed data is in the PPI and in the PPIR databases.
Federal Reserve Policies to Ease Credit and Their Implications for the Fed's Balance Sheet is yesterday's speech by Federal Reserve Chairman Ben S. Bernanke and it can be found here.
The Federal Reserve on Wednesday released, for the first time, longer-run economic projections made by Federal Open Market Committee (FOMC) participants--the Federal Reserve Board members and Federal Reserve Bank presidents--in connection with their regular quarterly projections. The release can be found here.
| Producer Price Index (%) | January | December | Y/Y | 2008 | 2007 | 2006 |
|---|---|---|---|---|---|---|
| Finished Goods | 0.8 | -1.9 | -1.3 | 6.4 | 3.9 | 2.9 |
| Core | 0.4 | 0.2 | 4.2 | 3.4 | 2.0 | 1.5 |
| Intermediate Goods | -0.7 | -4.2 | -3.7 | 10.5 | 4.0 | 6.4 |
| Core | -1.1 | -2.9 | 1.2 | 7.6 | 2.8 | 6.0 |
| Crude Goods | -2.9 | -5.3 | -28.9 | 21.2 | 11.9 | 1.4 |
| Core | 0.1 | -2.2 | -27.8 | 15.0 | 15.6 | 20.8 |

Tom Moeller
AuthorMore in Author Profile »Prior to joining Haver Analytics in 2000, Mr. Moeller worked as the Economist at Chancellor Capital Management from 1985 to 1999. There, he developed comprehensive economic forecasts and interpreted economic data for equity and fixed income portfolio managers. Also at Chancellor, Mr. Moeller worked as an equity analyst and was responsible for researching and rating companies in the economically sensitive automobile and housing industries for investment in Chancellor’s equity portfolio. Prior to joining Chancellor, Mr. Moeller was an Economist at Citibank from 1979 to 1984. He also analyzed pricing behavior in the metals industry for the Council on Wage and Price Stability in Washington, D.C. In 1999, Mr. Moeller received the award for most accurate forecast from the Forecasters' Club of New York. From 1990 to 1992 he was President of the New York Association for Business Economists. Mr. Moeller earned an M.B.A. in Finance from Fordham University, where he graduated in 1987. He holds a Bachelor of Arts in Economics from George Washington University.
More Economy in Brief


