 Global| Mar 01 2004
U.S. Personal Income Up
by:Tom Moeller
|in:Economy in Brief
Summary
Personal income rose just 0.2% (+4.1% y/y) in January versus Consensus expectations for a 0.4% gain. The increase was held back by declines in proprietors' income and rental income which had been quite strong. Personal disposable [...]
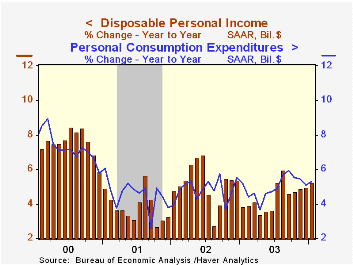
Personal income rose just 0.2% (+4.1% y/y) in January versus Consensus expectations for a 0.4% gain. The increase was held back by declines in proprietors' income and rental income which had been quite strong.
Personal disposable income jumped 0.8% (5.2% y/y), goosed by 4.9% drop in tax payments which are down 5.1% y/y.
Wages & salaries rose a strong 0.5% (+3.0% y/y) and the decline in December was lessened to -0.1%. The January gain was spread evenly across industries.
Proprietors' income fell 0.6% (+8.0% y/y) and rental income dropped 1.9% (+17.9% y/y).
Consumer spending rose a moderate 0.4%, the gain held back by a 3.3% decline in durable goods spending. Unit sales of light vehicles fell 9.0% m/m to 16.09M. Spending on nondurables jumped 1.5% (6.7% y/y) as higher gasoline prices, up 6.3% m/m, lifted the price deflator for nondurables by 0.7%. Services spending rose 0.7% (4.7% y/y).
The PCE price deflator rose 0.3%. Less food and energy prices rose 0.1% in January (0.8% y/y).
The savings rate ticked up to 1.8%.
| Disposition of Personal Income | Jan | Dec | Y/Y | 2003 | 2002 | 2001 |
|---|---|---|---|---|---|---|
| Personal Income | 0.2% | 0.3% | 4.1% | 3.2% | 2.3% | 3.4% |
| Personal Consumption | 0.4% | 0.5% | 5.3% | 5.0% | 4.8% | 4.5% |
| Savings Rate | 1.8% | 1.4% | 1.7% | 2.0% | 2.3% | 1.7% |
| PCE Price Deflator | 0.3% | 0.2% | 1.5% | 1.8% | 1.4% | 2.0% |
by Tom Moeller March 1, 2004
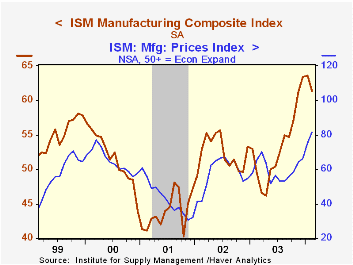
The Purchasing Managers’ Composite Index (PMI) released by the Institute of Supply Management fell to 61.4 in February from 63.6 in January. Consensus expectations were for a lesser decline to 62.0.
During the last twenty years there has been a 71% correlation between the level of the Composite Index and the three month growth in factory sector industrial production. There has been a 58% correlation between the level of the Composite Index and quarterly growth in real GDP.
The new orders index dropped to 66.4 from 71.1. The series' high was in December at 73.1. The production index fell to 63.9 from 71.1.
The employment index rose sharply to 56.3, the highest level since December 1987. There has been a 65% correlation during the last twenty years between the ISM employment index and the one-month change in factory sector payrolls.
The inventory index improved to 49.4. The Jan-Feb average of 49.2 is versus 44.5 during all of last year and a low of 39.6 during 2001.
The prices paid index jumped further to 81.5, the highest level since January 1995.
| ISM Manufacturing Survey | Feb | Jan | Feb '03 | 2003 | 2002 | 2001 |
|---|---|---|---|---|---|---|
| Composite Index | 61.4 | 63.6 | 49.4 | 53.3 | 52.4 | 43.9 |
| New Orders Index | 66.4 | 71.1 | 51.9 | 58.1 | 56.6 | 46.1 |
| Prices Paid Index (NSA) | 81.5 | 75.5 | 65.5 | 59.6 | 57.6 | 42.9 |
by Tom Moeller March 1, 2004
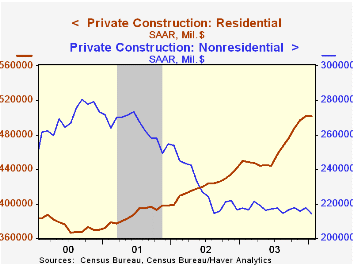
The value of total construction put in place fell 0.3% in January (+5.4% y/y). December activity was revised up due to a raised figure for nonresidential building. A 0.2% gain was expected for January.
Private residential building activity was unchanged following six months of strong gain (11.4% y/y). Single family home building fell a slight 0.2% (16.1% y/y).
Nonresidential building fell 1.7% following an upwardly revised December. Office building slumped 5.2% (-5.0% y/y) and commercial construction dropped 2.6% (-1.9% y/y). Education spending fell for the fifth month in the last seven (+1.0% y/y).
These more detailed categories represent the Census Bureau’s reclassification of construction activity into end-use groups. Finer detail is available for many of the categories; for instance, commercial construction is shown for Automotive sales and parking facilities, drugstores, building supply stores, and both commercial warehouses and mini-storage facilities. Note that start dates vary for some seasonally adjusted line items in 2000 and 2002 and that constant-dollar data are no longer computed.
| Construction Put-in-place | Jan | Dec | Y/Y | 2003 | 2002 | 2001 |
|---|---|---|---|---|---|---|
| Total | -0.3% | 0.6% | 5.4% | 4.0% | 1.1% | 2.7% |
| Private | -0.5% | 0.9% | 7.2% | 4.6% | -0.2% | 1.4% |
| Residential | 0.0% | 0.9% | 11.4% | 10.1% | 8.6% | 3.3% |
| Nonresidential | -1.7% | 1.1% | -1.5% | -5.5% | -13.0% | -1.3% |
| Public | 0.2% | -0.4% | -0.1% | 2.2% | 5.3% | 7.4% |

Tom Moeller
AuthorMore in Author Profile »Prior to joining Haver Analytics in 2000, Mr. Moeller worked as the Economist at Chancellor Capital Management from 1985 to 1999. There, he developed comprehensive economic forecasts and interpreted economic data for equity and fixed income portfolio managers. Also at Chancellor, Mr. Moeller worked as an equity analyst and was responsible for researching and rating companies in the economically sensitive automobile and housing industries for investment in Chancellor’s equity portfolio. Prior to joining Chancellor, Mr. Moeller was an Economist at Citibank from 1979 to 1984. He also analyzed pricing behavior in the metals industry for the Council on Wage and Price Stability in Washington, D.C. In 1999, Mr. Moeller received the award for most accurate forecast from the Forecasters' Club of New York. From 1990 to 1992 he was President of the New York Association for Business Economists. Mr. Moeller earned an M.B.A. in Finance from Fordham University, where he graduated in 1987. He holds a Bachelor of Arts in Economics from George Washington University.
More Economy in Brief


