 Global| Mar 31 2005
U.S. Personal Income Gain Light
by:Tom Moeller
|in:Economy in Brief
Summary
Personal income rose 0.3% in February. The modest gain followed a 2.5% January decline in the wake of Microsoft's dividend payment. Consensus expectations had been for a 0.4% rise for February. Disposable personal income rose 0.3% [...]
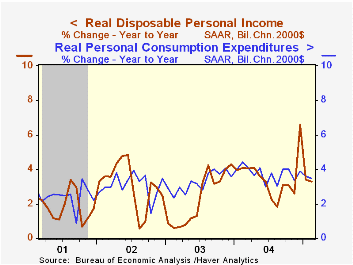
Personal income rose 0.3% in February. The modest gain followed a 2.5% January decline in the wake of Microsoft's dividend payment. Consensus expectations had been for a 0.4% rise for February.
Disposable personal income rose 0.3% (5.6% y/y) but adjusted for price inflation rose just 0.1% (3.3% y/y).
Wage & salary income edged up just 0.2% (5.5% y/y) in February, one of the weaker gains of the last year. Wages in service producing industries rose 0.1% 6.0% y/y) and factory sector wages rose 0.2% (5.5% y/y).
Personal consumption rose an expected 0.5%. Durable goods spending rose 0.9% (3.7% y/y) and spending on nondurables rose 0.6%, lifted by a 4.3% jump in gasoline prices. Services spending rose 0.5% (5.2% y/y).
The PCE chain price index rose 0.3% in February but less food & energy inflation eased slightly to 0.2%
| Disposition of Personal Income | Feb | Jan | Y/Y | 2004 | 2003 | 2002 |
|---|---|---|---|---|---|---|
| Personal Income | 0.3% | -2.5% | 5.8% | 5.6% | 3.2% | 1.8% |
| Personal Consumption | 0.5% | 0.1% | 5.8% | 6.0% | 5.2% | 4.6% |
| Savings Rate | 0.6% | 0.8% | 0.9% | 1.2% | 1.4% | 2.0% |
| PCE Chain Price Index | 0.3% | 0.2% | 2.3% | 2.2% | 1.9% | 1.4% |
| Less food & energy | 0.2% | 0.3% | 1.6% | 1.5% | 1.3% | 1.8% |
by Tom Moeller March 31, 2005
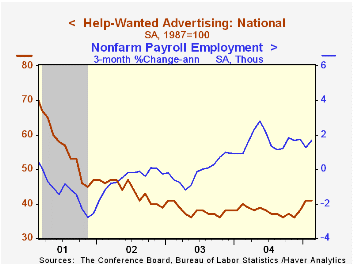
The Conference Board's National Index of Help-Wanted Advertising in February held onto the improvement during the prior month and was unchanged at 41.
During the last ten years there has been an 68% correlation between the level of help-wanted advertising and the three month change in non-farm payrolls.
The proportion of labor markets with rising want-ad volume slipped to 51% from 69% in January but remained up versus last year.
The Conference Board surveys help-wanted advertising volume in 51 major newspapers across the country every month.
The latest help wanted report from the Conference Board is available here.
| Conference Board | Feb | Jan | Feb '04 |
|---|---|---|---|
| National Help Wanted Index | 41 | 41 | 40 |
by Tom Moeller March 31, 2005
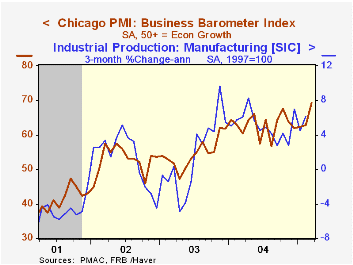
The Chicago Purchasing Managers Business Barometer for March jumped 6.5 points to 69.2 and easily surpassed Consensus expectations for a decline to 60.3. The surge was to the highest level since 1988.
The gain suggests improvement in tomorrow's ISM composite manufacturing index. During the last thirty years the correlation between the two indexes has exceeded 90% and there has been a 67% correlation between the level of the Chicago Business Barometer and the three month change in factory sector industrial output.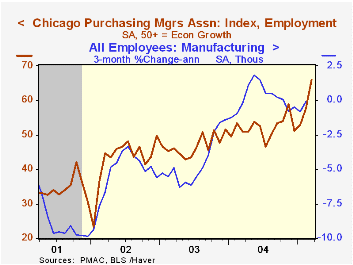
The employment index surged another 8.3 points to a near record 66.0. During the last ten years there has been a 78% correlation between the level of the employment index and the three month change in factory sector employment. The new orders and the production indexes also surged.
The index of prices paid fell again to the lowest level in a year. During the last ten years there has been an 86% correlation between the Chicago price index and the three month change in the "core" intermediate goods PPI.
| Chicago Purchasing Managers Index, SA | Mar | Feb | Mar '04 | 2004 | 2003 | 2002 |
|---|---|---|---|---|---|---|
| Business Barometer | 69.2 | 62.7 | 60.4 | 62.9 | 54.6 | 52.8 |
| New Orders | 76.7 | 68.5 | 61.6 | 67.0 | 58.0 | 56.2 |
| Prices Paid | 68.2 | 70.1 | 75.3 | 80.1 | 55.8 | 56.9 |
by Tom Moeller March 31, 2005
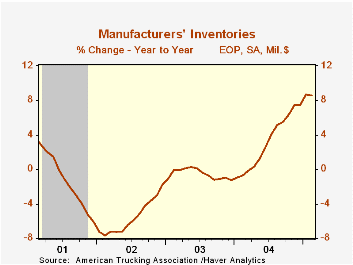
Factory inventories added 0.5% in February to the prior month's 1.5% spurt. Less petroleum inventories which fell 0.4% (16.7% y/y) the total increased 0.6% (8.3% y/y).
Factory shipments fell 0.9% in part reflecting a 2.9% drop in transportation equipment (-5.1% y/y). Less transportation shipments fell 0.6% (+13.3% y/y).
Orders to the factory sector rose 0.2%. The advance report of a 0.3% rise in durable goods was revised to 0.5% (+7.8% y/y). Nondefense capital goods orders less aircraft fell 1.7% (14.2% y/y).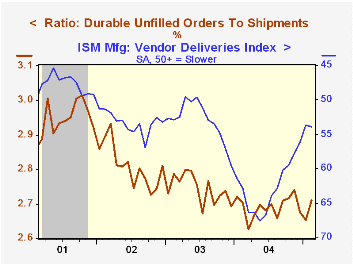
Unfilled orders jumped 0.6%. The ratio of unfilled orders to shipments for durables recovered most of the prior two months' declines.
| Factory Survey (NAICS) | Feb | Jan | Y/Y | 2004 | 2003 | 2002 |
|---|---|---|---|---|---|---|
| Inventories | 0.5% | 1.5% | 8.6% | 7.5% | -1.3% | -1.8% |
| New Orders | 0.2% | -0.0% | 10.0% | 10.9% | 3.7% | -1.9% |
| Shipments | -0.9% | 1.1% | 10.4% | 10.5% | 2.6% | -2.0% |
| Unfilled Orders | 0.6% | -0.0% | 8.8% | 9.1% | 4.2% | -6.1% |
by Tom Moeller March 31, 2005
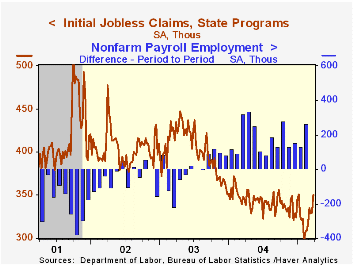
Initial claims for unemployment insurance rose 20,000 to 350,000 last week versus an upwardly revised level the prior week. Consensus expectations had been for 321,000 claims.
During the last ten years there has been a (negative) 74% correlation between the level of initial claims for unemployment insurance and the monthly change in payroll employment. There has been a (negative) 66% correlation with the level of continuing claims.
The four week moving average of initial claims rose to 336,000 (-1.2% y/y).
Continuing claims for unemployment insurance dropped 66,000 from the prior week and the insured rate of unemployment remained at 2.1%.
| Unemployment Insurance (000s) | 03/26/05 | 03/19/05 | Y/Y | 2004 | 2003 | 2002 |
|---|---|---|---|---|---|---|
| Initial Claims | 350 | 330 | 1.4% | 343 | 402 | 404 |
| Continuing Claims | -- | 2,608 | -11.6% | 2,926 | 3,531 | 3,570 |
by Carol Stone March 31, 2005
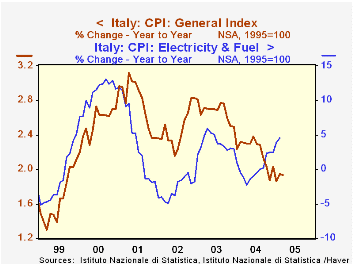
The Italian statistical agency Istat today reported that the March CPI was up 1.9% from March 2004. This result means that inflation in Italy has held at or below a 2% yearly pace for the last six months. The persistent decline to such a low rate in recent months seems impressive in light of the strong uptrend in world energy prices.
As seen in the table below, energy components of the Italian CPI array have indeed been strong, with transport-related fuel up 10% during 2004 and 7.7% in February from a year earlier (latest available for this line-item). The behavior of some other basic consumer price items suggests reasons for the moderate overall inflation: food prices in Italy are falling and clothing prices are rising very slowly. Food had seen outsized increases from 2001 through 2003, but steep declines in fruit and vegetables have led that segment down since early last year. Clothing prices are actually falling in a number of countries, and while they are rising in Italy, these increases have been progressively slower since the spring of 2003. Also, surprisingly -- at least to an American commentator -- health care prices are declining. The cost of medicine and pharmaceuticals fell at about a 6% pace in January and February. Notably, over the last couple of years, inflation rates for medications in the US have eased as well, but in Italy, these prices have been falling outright.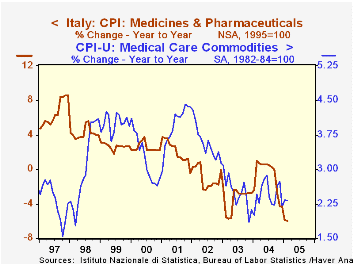
Thus, there are some cushions in the Italian price system against the impact of surging energy costs. So inflation may not automatically ratchet higher with every €1 increase in the price of a barrel of oil.
| Italy: Consumer Price Index Yr/Yr % Change |
Mar 2005 | Feb 2005 | Jan 2005 | December/December|||
|---|---|---|---|---|---|---|
| 2004 | 2003 | 2002 | ||||
| Total CPI | 1.9 | 1.9 | 1.9 | 2.0 | 2.5 | 2.8 |
| Food | -0.2 | -0.4 | -0.7 | -0.3 | 3.9 | 3.3 |
| Apparel | 1.7 | 1.8 | 1.8 | 1.8 | 2.6 | 3.1 |
| Transport Fuel | -- | 7.7 | 6.8 | 10.0 | 0.2 | 4.6 |
| Housing Electricity & Fuel | -- | 4.5 | 3.8 | 2.5 | 3.0 | -1.8 |
| Memo: Euro-Zone "Flash Estimate" | 2.1 | 2.1 | 1.9 | 2.4 | 2.0 | 2.3 |
| US CPI | -- | 3.0 | 3.0 | 3.3 | 1.9 | 2.4 |

Tom Moeller
AuthorMore in Author Profile »Prior to joining Haver Analytics in 2000, Mr. Moeller worked as the Economist at Chancellor Capital Management from 1985 to 1999. There, he developed comprehensive economic forecasts and interpreted economic data for equity and fixed income portfolio managers. Also at Chancellor, Mr. Moeller worked as an equity analyst and was responsible for researching and rating companies in the economically sensitive automobile and housing industries for investment in Chancellor’s equity portfolio. Prior to joining Chancellor, Mr. Moeller was an Economist at Citibank from 1979 to 1984. He also analyzed pricing behavior in the metals industry for the Council on Wage and Price Stability in Washington, D.C. In 1999, Mr. Moeller received the award for most accurate forecast from the Forecasters' Club of New York. From 1990 to 1992 he was President of the New York Association for Business Economists. Mr. Moeller earned an M.B.A. in Finance from Fordham University, where he graduated in 1987. He holds a Bachelor of Arts in Economics from George Washington University.
More Economy in Brief


