 Global| Nov 01 2004
U.S. Personal Income Gain Light
by:Tom Moeller
|in:Economy in Brief
Summary
Personal income grew just 0.2% In September following a downwardly revised 0.1% rise in August. Consensus expectations had been for a 0.3% September increase. A third consecutive monthly decline in proprietors' income, down 0.4% [...]
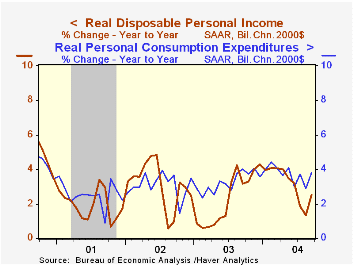
Personal income grew just 0.2% In September following a downwardly revised 0.1% rise in August. Consensus expectations had been for a 0.3% September increase.
A third consecutive monthly decline in proprietors' income, down 0.4% (+4.9% y/y), generated the disappointment in total personal income growth. Wages & salaries rose 0.4% (+4.6% y/y), the third firm consecutive monthly gain. Manufacturing wages rose 0.3% (2.0% y/y) and wages in private service producing industries rose 0.4% (5.4% y/y).
Personal disposable income rose a scant 0.1% (4.6% y/y) following downwardly revised gains in months prior that have been weak since June. Adjusted for inflation disposable income was unchanged (2.5% y/y). Personal taxes rose 0.6% (5.3% y/y).
"Public Officials and Job Creation" from the Federal Reserve Bank of St. Louis is available here.
Consumer spending rose 0.6% following a slight dip in August that was initially reported as unchanged. Durables purchases recovered most of the prior month's drop with a 1.6% jump as light vehicle sales jumped 5.5% to the second highest level of the year. Purchases of non-durable goods rose 0.5% (7.3% y/y) and services spending rose 0.4% (5.6% y/y).
The PCE chain price index ticked up 0.1% as did prices less food & energy (+1.5% y/y).
A recent speech by Fed Vice Chairman Roger W. Ferguson, Jr. titled "Equilibrium Real Interest Rate: Theory and Application" is available here.
| Disposition of Personal Income | Sept | Aug | Y/Y | 2003 | 2002 | 2001 |
|---|---|---|---|---|---|---|
| Personal Income | 0.2% | 0.3% | 4.6% | 3.2% | 1.8% | 3.5% |
| Personal Consumption | 0.6% | -0.1% | 5.9% | 5.2% | 4.6% | 4.7% |
| Savings Rate | 0.2% | 0.7% | 1.4% | 1.4% | 2.0% | 1.8% |
| PCE Chain Price Index | 0.1% | 0.0% | 2.0% | 1.9% | 1.4% | 2.1% |
by Tom Moeller November 1, 2004
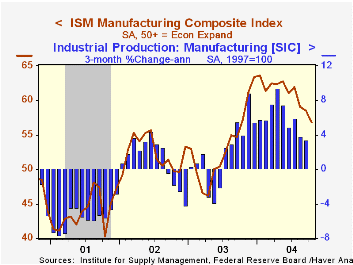
The Institute of Supply Management reported that its Purchasing Managers’ Composite Index (PMI) fell in October to 56.8 versus Consensus expectations for no change at 58.5.
During the last twenty years there has been a 70% correlation between the level of the Composite Index and the three month growth in factory sector industrial production.
The Composite Index reflected declines in each of the components except new orders. The employment index (54.8) dropped to the lowest since January and production cratered to the lowest in over a year.
The separate index of export orders rose sharply to 56.6, the highest level since June.
The prices paid index recouped much of the prior month's decline and rose to 78.5.
| ISM Manufacturing Survey | Oct | Sept | Oct '03 | 2003 | 2002 | 2001 |
|---|---|---|---|---|---|---|
| Composite Index | 56.8 | 58.5 | 57.1 | 53.3 | 52.4 | 43.9 |
| New Orders Index | 58.3 | 58.1 | 64.6 | 58.1 | 56.6 | 46.1 |
| Prices Paid Index (NSA) | 78.5 | 76.0 | 58.5 | 59.6 | 57.6 | 42.9 |
by Tom Moeller November 1, 2004
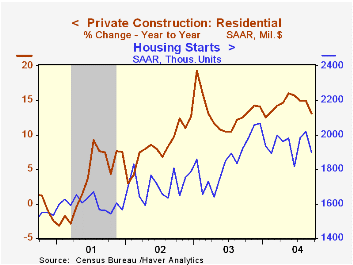
The total value of construction put in place dipped slightly in September as residential building fell for the first month since February 2003. The Consensus expectation for a 0.4% gain.
As hurricanes hit Florida, private residential building activity fell 0.2%. New single family building slid 0.8% (+17.3% y/y) after a 2.3% spurt in August.
Nonresidential building rose 0.2% (+5.7% y/y) as construction activity on shopping malls ballooned 30.7% (6.4% y/y).
Public construction rose 0.3% though spending on highways & streets, nearly one third of the value of public construction spending, fell for the fifth consecutive month (-1.3% y/y).
These more detailed categories represent the Census Bureau’s reclassification of construction activity into end-use groups. Finer detail is available for many of the categories; for instance, commercial construction is shown for Automotive sales and parking facilities, drugstores, building supply stores, and both commercial warehouses and mini-storage facilities. Note that start dates vary for some seasonally adjusted line items in 2000 and 2002 and that constant-dollar data are no longer computed.
| Construction Put-in-place | Sept | Aug | Y/Y | 2003 | 2002 | 2001 |
|---|---|---|---|---|---|---|
| Total | -0.0% | 0.9% | 8.9% | 5.1% | 1.5% | 3.5% |
| Private | -0.1% | 1.5% | 10.9% | 6.0% | -0.2% | 1.4% |
| Residential | -0.2% | 1.8% | 13.1% | 13.1% | 8.4% | 3.3% |
| Nonresidential | 0.2% | 0.7% | 5.7% | -7.1% | -12.8% | -1.3% |
| Public | 0.3% | -1.0% | 3.0% | 2.6% | 7.0% | 10.7% |

Tom Moeller
AuthorMore in Author Profile »Prior to joining Haver Analytics in 2000, Mr. Moeller worked as the Economist at Chancellor Capital Management from 1985 to 1999. There, he developed comprehensive economic forecasts and interpreted economic data for equity and fixed income portfolio managers. Also at Chancellor, Mr. Moeller worked as an equity analyst and was responsible for researching and rating companies in the economically sensitive automobile and housing industries for investment in Chancellor’s equity portfolio. Prior to joining Chancellor, Mr. Moeller was an Economist at Citibank from 1979 to 1984. He also analyzed pricing behavior in the metals industry for the Council on Wage and Price Stability in Washington, D.C. In 1999, Mr. Moeller received the award for most accurate forecast from the Forecasters' Club of New York. From 1990 to 1992 he was President of the New York Association for Business Economists. Mr. Moeller earned an M.B.A. in Finance from Fordham University, where he graduated in 1987. He holds a Bachelor of Arts in Economics from George Washington University.
More Economy in Brief


