 Global| Dec 10 2008
U.S. Pending Home Sales Fell
by:Tom Moeller
|in:Economy in Brief
Summary
The National Association of Realtors indicated that October pending sales of existing homes fell 0.7% m/m after September's 4.3% decline. Consensus expectations were for a greater 3.0% drop. Despite the two latest declines the level [...]
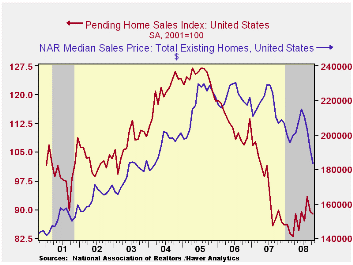
The National Association of Realtors indicated that October pending sales of existing homes fell 0.7% m/m after September's 4.3% decline. Consensus expectations were for a greater 3.0% drop. Despite the two latest declines the level of sales on a three-month basis continued to rise, up 7.5% from the March low.
The home sales figures are analogous to the new home sales data from the Commerce Department in that they measure existing home sales when the sales contract is signed, not at the time the sale is closed. The series dates back to 2001.
Lower prices continued to bolster home sales. The median sales price of an existing home fell for the fourth straight month during October (-11.3% y/y). Prices were down 20.0% from their peak during June of last year. For single-family homes, prices fell 4.5% during October and prices were off 20.7% from their peak.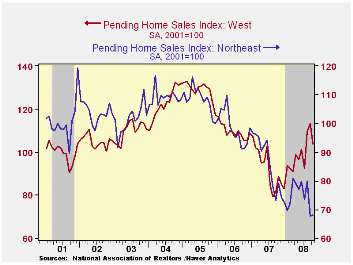
Weakness in the West led the October sales' decline, but not by enough to stall the upward trend. On a three-month basis sales in the West rose to the highest level since the summer of 2006. Sales in the Midwest also were weak during October. The 4.3% decline followed a 0.7% downtick during September. October sales in the South were the strongest of the regions and they rose 7.8%. That pulled the 3-month average to its highest level since March. Home sales in the Northeast ticked up 0.6% but that followed a 15.2% m/m decline during September. The 3-month level of sales was near the lowest for this cycle,
Weak home sales are encouraging potential sellers to keep their homes off the market. The Realtors Association indicated in an earlier report that the number of homes on the market and available for sale fell for the third consecutive month (-4.5% y/y).
At the current sales rate there was a 10.2 months' supply of homes on the market, higher than 8.9 months last year and 6.5 months during 2006. For single family homes the months' supply ticked up to 9.6, near the lowest since March but still well above the 8.7 average of last year.
The pending home sales data are available in Haver's PREALTOR database and the number of homes on the market and prices are in the REALTOR database.
U.S. Economic Growth Will Be Weak in 2009, Chicago Fed Economic Outlook Symposium. Click here for the summary.
| Pending Home Sales (2001=100) | October | September | Y/Y | 2007 | 2006 | 2005 |
|---|---|---|---|---|---|---|
| Total | 88.9 | 89.5 | -1.0% | 95.7 | 112.1 | 124.3 |
| Northeast | 68.1 | 67.7 | -14.1 | 85.6 | 98.5 | 108.3 |
| Midwest | 79.7 | 83.3 | -6.8 | 89.6 | 102.0 | 116.4 |
| South | 95.9 | 89.0 | -2.9 | 107.3 | 127.3 | 134.8 |
| West | 103.7 | 113.6 | 17.3 | 92.1 | 109.5 | 128.6 |

Tom Moeller
AuthorMore in Author Profile »Prior to joining Haver Analytics in 2000, Mr. Moeller worked as the Economist at Chancellor Capital Management from 1985 to 1999. There, he developed comprehensive economic forecasts and interpreted economic data for equity and fixed income portfolio managers. Also at Chancellor, Mr. Moeller worked as an equity analyst and was responsible for researching and rating companies in the economically sensitive automobile and housing industries for investment in Chancellor’s equity portfolio. Prior to joining Chancellor, Mr. Moeller was an Economist at Citibank from 1979 to 1984. He also analyzed pricing behavior in the metals industry for the Council on Wage and Price Stability in Washington, D.C. In 1999, Mr. Moeller received the award for most accurate forecast from the Forecasters' Club of New York. From 1990 to 1992 he was President of the New York Association for Business Economists. Mr. Moeller earned an M.B.A. in Finance from Fordham University, where he graduated in 1987. He holds a Bachelor of Arts in Economics from George Washington University.
More Economy in Brief


