 Global| Feb 06 2009
U.S. Payrolls Slashed 598,000; Jobless Rate Rose To 7.6%
by:Tom Moeller
|in:Economy in Brief
Summary
The bad news from the labor market continued unabated last month. The Bureau of Labor Statistics indicated that January nonfarm payrolls were slashed by 598,000 after cuts of 577,000 and 597,000 during the prior two months. Both of [...]
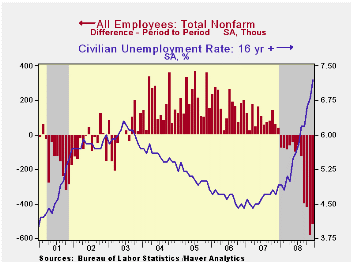
The bad news from the labor market continued unabated last month. The Bureau of Labor Statistics indicated that January nonfarm payrolls were slashed by 598,000 after cuts of 577,000 and 597,000 during the prior two months. Both of these latter figures were downwardly revised and the January cut was the largest for any one month since December 1974. The January decline exceeded Consensus expectations for a 530,000 drop.
The unemployment rate jumped to 7.6%
which was its highest level since September 1992. The increase exceeded
Consensus expectations for a rise to 7.5%. The 2.7 percentage point
rise in the jobless rate over the last twelve months from 4.9% is the
sharpest for any year since 1975. January household sector
employment fell a huge 1.239 million (-2.9% y/y), near the postwar
record. The labor force fell 731,000 (-0.1% y/y as the number
of potential workers who were not in labor force but wanted a job, i.e.
the "discouraged worker," rose by 15.9% y/y. The labor force
participation rate fell to 65.5%, its lowest since 1987. The number of
those who were unemployed last month rose 508,000. The figure was up
4.1 million, or 53.8% during the last twelve months.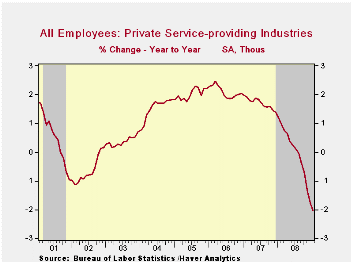
The average duration of unemployment rose slightly to 19.8 weeks, near the highest since 1983. The number of those unemployed for more than 27 weeks rose another 2.2% after a 17.4% December surge and it nearly doubled year-to-year.
From the payroll survey, private service sector employment weakened as in no other period during the last 60 years. Over the last three months 954,000 jobs were shed, or 1.0% of the total. During that period 351,000 jobs (-2.0%) were lost from the professional & business services sector and 114,000 jobs (-1.4%) were lost from the financial services sector. The leisure and hospitality industry shed 110,000 jobs (-0.8%) during the last three months and 219,000 were cut (-1.4%) from the retail sector. About the only sector to show growth in jobs was health services where jobs rose 105,000 during the last three months, or by 0.7%. Jobs in education also rose a moderate 56,000 during that period (1.8%).
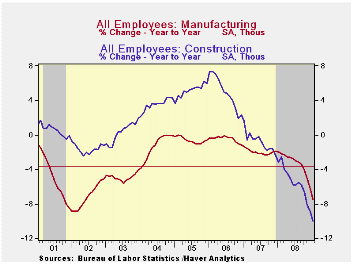
Factory sector jobs were cut by 207,000 last month which was the largest one-month decline since 1982. Over the last three months the rate of factory sector job reduction accelerated further to 490,000, or 3.7%. That was the quickest since 1980.
Construction sector employment fell another 111,000 during
January and over the last three months 324,000 jobs were cut, or by
4.6%. Hardest hit was the residential building sector where 45,600 jobs
(-5.7%) were lost over the last three months. Over the last twelve
months 747,000 jobs were shed (-10.0%) from the construction sector
overall.
Comparing Current Payroll Employment Changes with Past Recessions from the Federal Reserve Bank of Cleveland is available here.
Modest hiring in the government sector continued last month and payrolls rose 6,000. However, payrolls are flat since this past summer. State and local government hiring has been slightly negative during the last three months and hiring by the federal government rose a bit.
The length of the average workweek remained stable at the reduced level of 33.3 hours. It continued as the shortest workweek on record.
Continuing to suggest further declines in employment was the
one month diffusion index, which measures the
breadth of job gain or loss (50 is the break-even level). It fell to
its lowest level of this cycle (25.3%). The three-month index also was
at its cycle low at 22.9% and the three-month figure for the factory
sector was even weaker at 8.4%.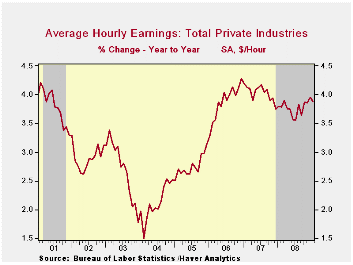
Average hourly earnings rose 0.3% versus an
expectation for a 0.2% increase. Earnings the factory sector fell 0.1%
(+2.8% y/y) while private services wages rose 0.8% (4.0% y/y).
The figures referenced above are available in Haver's USECON database. Additional detail can be found in the LABOR database.
The Term Structure of Inflation Expectations from the Federal Reserve Bank of New York can be found here.
Global Liquidity and Exchange Rates, also from the Federal Reserve Bank of New York is available here.
| Employment: 000s | January | December | November | Y/Y | 2008 | 2007 | 2006 |
|---|---|---|---|---|---|---|---|
| Payroll Employment | -598 | -577 | -597 | -2.5% | -0.4% | 1.1% | 1.8% |
| Previous | -- | -524 | -584 | -- | -0.3% | 1.1% | 1.8% |
| Manufacturing | -207 | -162 | -121 | -7.5% | -3.3% | -2.0% | -0.5% |
| Construction | -111 | -86 | -127 | -10.0% | -5.5% | -0.8% | 4.9% |
| Service Producing | -279 | -327 | -348 | -1.5% | 0.2% | 1.6% | 1.8% |
| Average Weekly Hours | 33.3 | 33.3 | 33.4 | 33.7 (Jan. '08) | 33.6 | 33.8 | 33.9 |
| Average Hourly Earnings | 0.3% | 0.4% | 0.3% | 3.9% | 3.8% | 4.0% | 3.9% |
| Unemployment Rate | 7.6% | 7.2% | 6.8% | 4.9% (Jan. '08) | 5.8% | 4.6% | 4.6% |
by Robert Brusca February 5, 2009
German IP is dropping fast with the headline off by 4.6% in
December following a November decline of 3.8%. In the fourth quarter,
German IP is falling at a 24.6% annual rate. The steel industry reports
orders falling faster than any time since WWII. Yr/Yr the drop in
overall output is a very substantial minus 12%; Yr/Yr weakness
permeates sectors.
The German consumer sector is not lively but since it never went anywhere it is not surprising it is now falling by the least down at a -5.8% annual rate over three months and by -5.3% Yr/Yr. Capital goods output is declining at an increasingly precipitous pace, the same is true for intermediate goods output. Construction has continued to rise in the month and is up over three-months at a faster pace than it is up over six months. Still manufacturing and, as we have previously seen, manufacturing orders are enormously weak.
| German Orders and Sales By Sector and Origin | ||||||||
|---|---|---|---|---|---|---|---|---|
| Real and SA | % M/M | % Saar | ||||||
| Dec-08 | Nov-08 | Oct-08 | 3-MO | 6-Mo | 12-Mo | YrAgo | QTR-2-Date | |
| Total Orders | -6.9% | -5.3% | -6.3% | -53.5% | -31.8% | -27.7% | 10.6% | -49.6% |
| Foreign | -9.4% | -3.7% | -6.3% | -55.4% | -33.2% | -31.7% | 13.5% | -53.5% |
| Domestic | -4.3% | -7.0% | -6.4% | -51.8% | -30.6% | -23.4% | 7.7% | -45.3% |
| Real Sector Sales | ||||||||
| MFG/Mining | -6.2% | -4.4% | -0.1% | -35.5% | -19.7% | -13.2% | 5.1% | -23.2% |
| Consumer | 2.7% | -2.3% | -0.1% | 1.2% | 0.6% | -2.9% | 2.0% | -3.4% |
| Cons Durables | -3.6% | -3.6% | -1.1% | -28.6% | -15.5% | -13.0% | 0.7% | -23.8% |
| Cons Non-Durable | 3.9% | -2.0% | 0.1% | 8.0% | 3.9% | -0.8% | 2.3% | 1.2% |
| Capital Goods | -8.7% | -4.7% | 1.0% | -40.5% | -22.9% | -14.9% | 7.9% | -24.4% |
| Intermediate Goods | -8.0% | -5.4% | -1.3% | -45.4% | -26.1% | -16.9% | 3.5% | -31.1% |
| All MFG-Sales | -6.0% | -4.2% | 0.0% | -34.2% | -18.9% | -12.7% | 4.6% | -22.2% |

Tom Moeller
AuthorMore in Author Profile »Prior to joining Haver Analytics in 2000, Mr. Moeller worked as the Economist at Chancellor Capital Management from 1985 to 1999. There, he developed comprehensive economic forecasts and interpreted economic data for equity and fixed income portfolio managers. Also at Chancellor, Mr. Moeller worked as an equity analyst and was responsible for researching and rating companies in the economically sensitive automobile and housing industries for investment in Chancellor’s equity portfolio. Prior to joining Chancellor, Mr. Moeller was an Economist at Citibank from 1979 to 1984. He also analyzed pricing behavior in the metals industry for the Council on Wage and Price Stability in Washington, D.C. In 1999, Mr. Moeller received the award for most accurate forecast from the Forecasters' Club of New York. From 1990 to 1992 he was President of the New York Association for Business Economists. Mr. Moeller earned an M.B.A. in Finance from Fordham University, where he graduated in 1987. He holds a Bachelor of Arts in Economics from George Washington University.
More Economy in Brief


