 Global| Jan 27 2010
U.S. New Home Sales Drop Again & Remain 75% Below Peak
by:Tom Moeller
|in:Economy in Brief
Summary
For new or existing home sales, December was a bleak month. Following Monday's report that existing home sales dropped sharply, the Commerce Department reported today that new home sales fell 7.6% m/m to 342,000 from an upwardly [...]
 For
new or existing home sales, December was a bleak month. Following
Monday's report that existing home sales dropped sharply, the Commerce
Department reported today that new home sales fell 7.6% m/m to 342,000
from an upwardly revised November level. The latest was the fourth
decline in the last five months. December sales were the lowest since
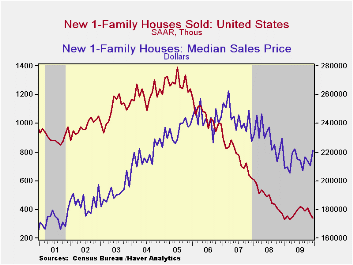
last March and off 75.4% from the 2005 peak. Near term home sales
should be helped by the recent extension of the Federal government's
tax credit which now it is for all home buyers and not just first-time
purchases. The December sales figure fell well short of Consensus
expectations for 370,000 sales.
For
new or existing home sales, December was a bleak month. Following
Monday's report that existing home sales dropped sharply, the Commerce
Department reported today that new home sales fell 7.6% m/m to 342,000
from an upwardly revised November level. The latest was the fourth
decline in the last five months. December sales were the lowest since
last March and off 75.4% from the 2005 peak. Near term home sales
should be helped by the recent extension of the Federal government's
tax credit which now it is for all home buyers and not just first-time
purchases. The December sales figure fell well short of Consensus
expectations for 370,000 sales.
The December results capped a dismal year. For 2009 as a whole new home sales totaled 372,000 which was the lowest level since the numbers were first tallied in 1963.
Home prices firmed during December though the November figure was revised down. The median price of a new single-family home rose to $221,300 which was the highest level since May. The increase pared the y/y decline to 3.6% from its worst of -14.5% this past February. For all of 2009 median home prices fell 7.3% after a 5.5% decline during 2008.
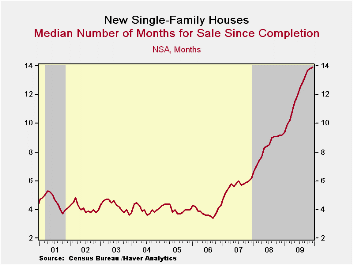
Price discounts and lower housing starts drove down the inventory of unsold homes by more than one-third y/y to its lowest since early-1971. The months' supply of unsold homes rose modestly to 8.1 months but remained down from the high of 12.4 months in January '09. Despite the shrinkage of inventory, it still took a record median 13.9 months to sell a new home.
Inflation: Mind the Gap from the Federal Reserve Bank of San Francisco is available here.

| US New Homes | December | November | October | Y/Y | 2009 | 2008 | 2007 |
|---|---|---|---|---|---|---|---|
| Total Sales (SAAR, 000s) | 342 | 370 | 408 | -8.6% | 372 | 481 | 769 |
| Northeast | 40 | 28 | 33 | 33.3 | 31 | 35 | 64 |
| Midwest | 43 | 73 | 56 | -27.1 | 54 | 69 | 118 |
| South | 178 | 192 | 224 | -7.8 | 201 | 264 | 409 |
| West | 81 | 77 | 95 | -12.0 | 87 | 113 | 178 |
| Median Price (NSA, $) | 221,300 | 210,300 | 213,700 | -3.6 | 213,567 | 230,408 | 243,742 |

Tom Moeller
AuthorMore in Author Profile »Prior to joining Haver Analytics in 2000, Mr. Moeller worked as the Economist at Chancellor Capital Management from 1985 to 1999. There, he developed comprehensive economic forecasts and interpreted economic data for equity and fixed income portfolio managers. Also at Chancellor, Mr. Moeller worked as an equity analyst and was responsible for researching and rating companies in the economically sensitive automobile and housing industries for investment in Chancellor’s equity portfolio. Prior to joining Chancellor, Mr. Moeller was an Economist at Citibank from 1979 to 1984. He also analyzed pricing behavior in the metals industry for the Council on Wage and Price Stability in Washington, D.C. In 1999, Mr. Moeller received the award for most accurate forecast from the Forecasters' Club of New York. From 1990 to 1992 he was President of the New York Association for Business Economists. Mr. Moeller earned an M.B.A. in Finance from Fordham University, where he graduated in 1987. He holds a Bachelor of Arts in Economics from George Washington University.
More Economy in Brief


