 Global| Nov 26 2007
U.S. Loan Delinquencies Up, Real Estate Soared
by:Tom Moeller
|in:Economy in Brief
Summary
For all loans and leases during the third quarter, the Federal Reserve Board Reported that the delinquency rate increased to 2.12% from 1.86% during the second quarter of 2007. While a still low rate, delinquencies have risen to the [...]
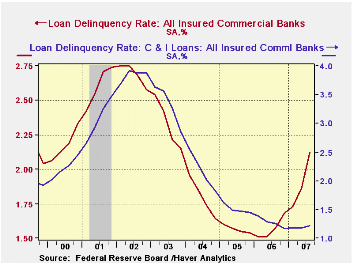
For all loans and leases during the third quarter, the Federal Reserve Board Reported that the delinquency rate increased to 2.12% from 1.86% during the second quarter of 2007. While a still low rate, delinquencies have risen to the highest level since late 2003.
The dollar value of these loans totaled $134 trillion, nearly double the level at the low during 2005 and double the running rate of $67 trillion during 1998.
Delinquent payments on residential real estate loans continued
to power the overall rise. Rising to 2.37% of all real estate loans,
the current rate is the highest since 1997. Commercial real
estate loans remain fairly current with a delinquency rate of
1.94%, but late payments on residential real estate loans
jumped to 2.74% last quarter, the highest since 2003.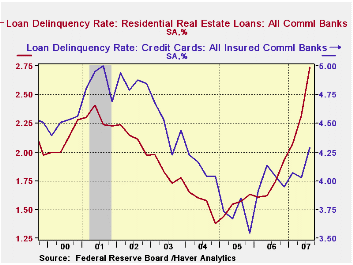
The dollar value of those delinquent residential real estate loans jumped to $52.1 trillion, more than four times the level ten years ago and more than one third the dollar value of late payments of bank's books. The crunch has come with the rise in short term interest rates as they have raised the reset rates on adjustable rate loans, notably those written for payments of interest only
For consumer loans delinquent payments also are up to a 3.14% rate versus 2.90% for all of last year. Delinquent payments on credit card debt rose to 4.29% from 4.01% last year but the gain is quite a bit larger for credit cards from the low of 3.54% late in 2005.
The dollar value of those delinquent credit card payments rose
amounted to $15.1 trillion, triple the low in 1994.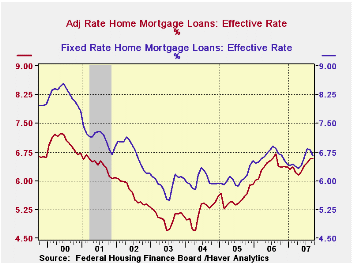
Delinquencies on C&I loans rose slightly q/q to 1.22% from 1.18% during 2Q and from 1.27% last year.
The dollar values of the these loans amounted to $16.2 trillion during 3Q, up 15% from last year but equaled just roughly ten percent of total delinquencies of the bank's books.
These data series are available in Haver's USECON database.
Gauging the Uncertainty of the Economic Outlook from Historical Forecasting Errors is a very recent working paper from the Federal Reserve Board and it can be found here.
| Loan Delinquency Rate (%) | 3Q '07 | 2Q '07 | 3Q '06 | 2006 | 2005 | 2004 |
|---|---|---|---|---|---|---|
| Total Loan & Leases | 2.12 | 1.86 | 1.57 | 1.57 | 1.56 | 1.80 |
| Consumer Loans | 3.14 | 2.99 | 2.93 | 2.90 | 2.81 | 3.08 |
| Real Estate Loans | 2.37 | 2.02 | 1.48 | 1.48 | 1.37 | 1.44 |
| Commercial & Industrial Loans | 1.22 | 1.18 | 1.25 | 1.27 | 1.51 | 2.17 |
by Tom Moeller November 26, 2007
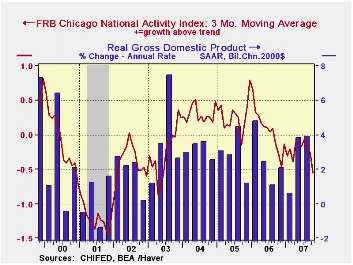
The National Activity Index (CFNAI) from the Federal Reserve Bank of Chicago during October ran negative for the third consecutive month at -0.73. It was the eight month in the last tenthat the index ran negative and it landed the three month moving average at its lowest level (-0.56) since 2003.
The Chicago Fed indicated that three of the four broad categories of indicators—employment, production, and consumption and housing—made negative contributions to the index.
A zero value of the CFNAI indicates that the economy is expanding at its historical trend rate of growth and during the last twenty years there has been a 68% correlation between the level of the CFNAI and q/q growth in real GDP.
The CFNAI is a weighted average of 85 indicators of economic activity. The indicators reflect activity in the following categories: production and income, the labor market, personal consumption and housing, manufacturing and trade sales, and inventories & orders.
The complete CFNAI report is available here.
| Chicago Fed | October | September | Oct. '06 | 2006 | 2005 | 2004 |
|---|---|---|---|---|---|---|
| CFNAI | -0.73 | -0.30 | -0.43 | 0.03 | 0.28 | 0.32 |
by Robert Brusca November 26, 2007
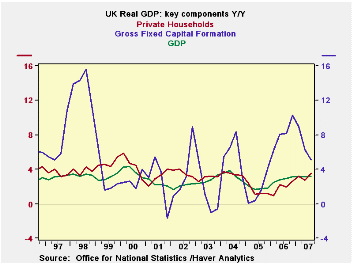
UK GDP slipped in the current quarter to a growth rate of 3% from 3.3% in Q2. And while it is a touch below its year/year pace of late it is also a touch above its five year range. Private consumption was strong in Q3 at an annualized quarterly pace of 4.1%. Above last quarter’s pace and well above the five-year trend. Public spending at 1.2% was slow. Capital spending at 6.7% was a sharp rebound but the year/year pace is slowing. Exports and imports each were up sharply on the quarter. Their past trends are hard to compare due to special factors in the historic pattern. Domestic demand remains solid in the UK. At 4.7% the quarter was up sharply and the year/year erosion to a pace of 3.5% was mild and is still above the five-year average. On balance GDP trends seem to be holding up well. It is the path of inflation that remains most in doubt, especially with oil prices flaring. Housing is getting decidedly weaker but there is no evidence of any knock-on impact on GDP.
| UK GDP | ||||||||
|---|---|---|---|---|---|---|---|---|
| Consumption | Capital Formation | Domestic | ||||||
| GDP | Private | Public | Total | Housing | Exports | Imports | Demand | |
| % change Q/Q | ||||||||
| Q3-07 | 3.0% | 4.1% | 1.2% | 6.7% | #N/A | 11.5% | 16.7% | 4.7% |
| Q2-07 | 3.3% | 3.0% | 1.4% | -3.7% | 1.7% | 0.6% | -1.6% | 2.6% |
| Q1-07 | 3.2% | 2.7% | 1.9% | 4.4% | 10.5% | 0.9% | 4.6% | 4.2% |
| Q4-06 | 3.3% | 4.4% | 2.7% | 13.7% | -9.7% | 0.9% | -1.8% | 2.4% |
| % change Yr/Yr | ||||||||
| Q3-07 | 3.2% | 3.5% | 1.8% | 5.1% | #N/A | 3.4% | 4.2% | 3.5% |
| Q2-07 | 3.1% | 2.7% | 2.0% | 6.2% | 3.7% | -12.4% | -9.9% | 3.6% |
| Q1-07 | 3.1% | 3.2% | 1.2% | 9.0% | 6.6% | -10.2% | -7.1% | 3.8% |
| Q4-06 | 3.2% | 2.6% | 1.9% | 10.3% | 6.4% | -2.4% | -0.6% | 3.6% |
| 5-Yrs | 2.8% | 2.7% | 2.6% | 4.4% | #N/A | 4.0% | 4.7% | 3.0% |
by Louise Curley November 26, 2007
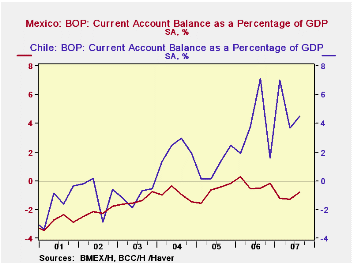
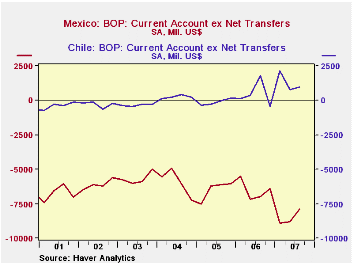
Mexico and Chile released third quarter data on their balances
of payments today. Mexico's account balance continues to run between a
little below and a little above -1% of GDP while that of Chile has been
positive for the past three years and has ranged between 4-7% of GDP so
far this year. The trends in the Current account as percentage of GDP
are shown in the first chart.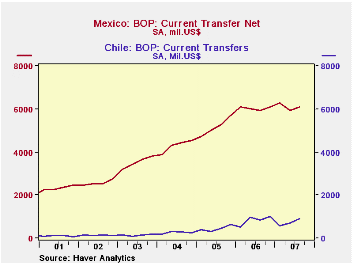
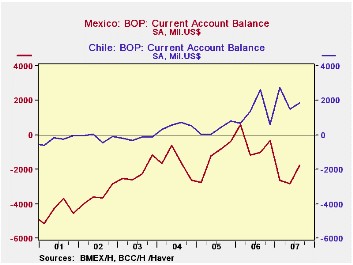
In dollar terms, Mexico's current account was -$1768 million US in the third quarter of this year, an improvement over the deficits of $2844 and $2624 million in the second and first quarters of the year. In Chile, the current account was $1869 in the third quarter. The trend in the current account of each country is shown in the second chart. In both cases, but to a far greater degree in Mexico than in Chile, remittances from their nationals working abroad have been significant factors in reducing the current account balances. The third charts shows the relative magnitudes of net transfers in the two countries and the fourth chart shows the current account of each country excluding net transfers.
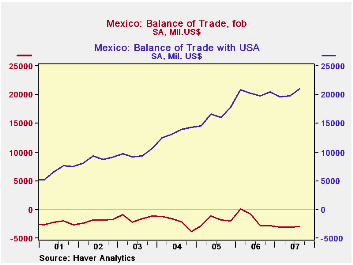
Another striking feature of Mexico's current account is the dominance of US trade. In the third quarter the total balance of trade in goods was-$2,926 million, but the balance of trade in goods with the US was a positive $20994 million as shown in the fifth chart.
| Balances of Payments (Mil. US$) | Q3 07 | Q2 07 | Q1 07 | 2006 | 2005 | 2004 |
|---|---|---|---|---|---|---|
| CHILE | ||||||
| Current Account (% of GDP) | 4.52 | 3.67 | 7.05 | 3.59 | 1.02 | 2.16 |
| Current Account (Mil. US$) | 1869 | 1497 | 2759 | 5256 | 1315 | 2074 |
| Net Transfer (Mil. US$) | 905 | 589 | 589 | 3357 | 1791 | 1072 |
| Current Account ex Net Transfers | 964 | 782 | 2170 | 1899 | -476 | 1003 |
| MEXICO | ||||||
| Current Account (% of GDP) | -0.78 | -1.30 | -1.22 | -0.22 | -0.70 | -0.95 |
| Current Account (Mil. US$) | -1768 | -2844 | -2624 | -1928 | -5179 | -6576 |
| Net Transfer (Mil. US$) | 6091 | 5934 | 6268 | 24127 | 20736 | 17162 |
| Current Account ex Net Transfers | -8859 | -8778 | -8892 | -26055 | -25915 | -23738 |
| Balance on Trade in Goods | -2926 | -3083 | -3049 | -6242 | -7655 | -8755 |
| Balance on Trade in Goods with USA | 20994 | 19776 | 19624 | 81466 | 65019 | 53698 |

Tom Moeller
AuthorMore in Author Profile »Prior to joining Haver Analytics in 2000, Mr. Moeller worked as the Economist at Chancellor Capital Management from 1985 to 1999. There, he developed comprehensive economic forecasts and interpreted economic data for equity and fixed income portfolio managers. Also at Chancellor, Mr. Moeller worked as an equity analyst and was responsible for researching and rating companies in the economically sensitive automobile and housing industries for investment in Chancellor’s equity portfolio. Prior to joining Chancellor, Mr. Moeller was an Economist at Citibank from 1979 to 1984. He also analyzed pricing behavior in the metals industry for the Council on Wage and Price Stability in Washington, D.C. In 1999, Mr. Moeller received the award for most accurate forecast from the Forecasters' Club of New York. From 1990 to 1992 he was President of the New York Association for Business Economists. Mr. Moeller earned an M.B.A. in Finance from Fordham University, where he graduated in 1987. He holds a Bachelor of Arts in Economics from George Washington University.
More Economy in Brief


