 Global| Jul 03 2002
U.S. Light Vehicle Sales Recover
by:Tom Moeller
|in:Economy in Brief
Summary
Light vehicle sales rose 5.2% last month versus May. The rise in sales was very slightly more than expected following a 9.7% decline in May. Vehicle sales in 2Q rose 1.2% from 1Q to an average of 16.50M units. Sales of domestically [...]
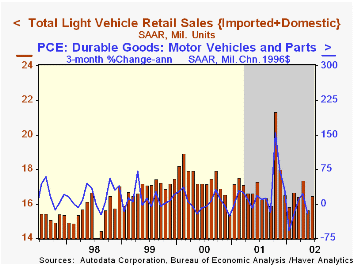
Light vehicle sales rose 5.2% last month versus May. The rise in sales was very slightly more than expected following a 9.7% decline in May. Vehicle sales in 2Q rose 1.2% from 1Q to an average of 16.50M units.
Sales of domestically built cars and trucks rose 4.2% m/m. 2Q sales of domestics rose 2.2% from the 1Q average.
Imported vehicle sales rose 9.4% vs. May. Sales of imports in 2Q fell 3.0% from the 1Q average.
Imports captured 19.6% of the US light vehicle market in 2Q02 versus 20.4% in 1Q and 17.8% last year.
Sales of cars (-5.5% y/y) and light trucks (-3.6% y/y) both rose last month versus May.
| Light Vehicle Sales (SAAR, Mil.Units) | June | May | Y/Y | 2001 | 2000 | 1999 |
|---|---|---|---|---|---|---|
| Total | 16.48 | 15.67 | -4.5% | 17.21 | 17.40 | 16.95 |
| Domestic | 13.19 | 12.67 | -7.2% | 14.15 | 14.58 | 14.47 |
| Imported | 3.29 | 3.00 | 7.9% | 3.06 | 2.82 | 2.48 |
by Tom Moeller July 3, 2002
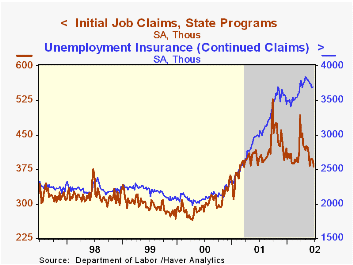
Initial claims for unemployment insurance fell about as expected in the latest week. The prior week's level was revised up slightly.
Continuing claims for unemployment insurance rose slightly from the prior week's level which fell sharply and was revised down.
The four-week moving average of initial claims was little changed at 392,000 (-1.8% y/y).
The insured rate of unemployment was stable at 2.9% for the fourth consecutive week.
| Unemployment Insurance (000s) | 6/29/02 | 6/22/02 | Y/Y | 2001 | 2000 | 1999 |
|---|---|---|---|---|---|---|
| Initial Claims | 382.0 | 393.0 | -4.0% | 405.8 | 299.8 | 297.7 |
| Continuing Claims | -- | 3,699 | 23.3% | 3,021 | 2,114 | 2,186 |
by Tom Moeller July 3, 2002
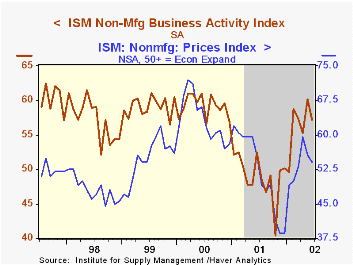
The Institute for Supply Management business activity index of the nonmanufacturing sector fell slightly more than expected last month following strength the month prior.
The overall index has remained above 50, the dividing line for expansion and contraction, since February.
Of the seasonally adjusted subgroups, new orders were about unchanged, employment fell and imports rose. The not seasonally adjusted index of export orders was quite strong.
The not seasonally adjusted index of prices fell for the second consecutive month.
Business activity for the nonmanufacturing sector is a question separate from the subgroups mentioned above. In contrast, the NAPM manufacturing sector composite index weights the components.
During the last four years, there has been a 43% correlation between the level of the NAPM nonmanufacturing index and quarterly growth in real GDP in the service sector.
ISM surveys more than 370 purchasing managers in more than 62 industries including construction, law firms, hospitals, government and retailers. The nonmanufacturing survey dates only to July 1997, therefore its seasonal adjustment should be viewed tentatively.
| ISM Nonmanufacturing Survey | June | May | Y/Y | 2001 | 2000 | 1999 |
|---|---|---|---|---|---|---|
| Business Activity Index | 57.2 | 60.1 | 52.4 | 49.0 | 59.2 | 59.1 |
by Tom Moeller July 3, 2002
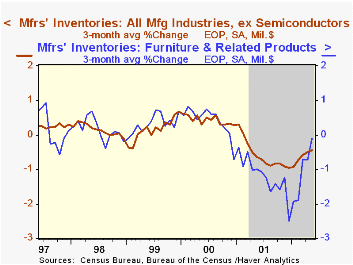
Manufacturing inventories fell for the sixteenth consecutive month in May. April's decline was revised slightly deeper and figures back to 1999 also were revised.
Inventory decumulation continued strong across the board, notably in the metals industries. Inventories of computers rose for the third month this year. Furniture & related products inventories rose after months of sharp decline since late 2000.
Shipments rose slightly (-3.2% y/y) following two months of sharp gain.
| Inventories | May | April | Y/Y | 2001 | 2000 | 1999 |
|---|---|---|---|---|---|---|
| Mfg Inventories | -0.4% | -0.3% | -8.6% | -8.0% | 4.5% | 3.1% |

Tom Moeller
AuthorMore in Author Profile »Prior to joining Haver Analytics in 2000, Mr. Moeller worked as the Economist at Chancellor Capital Management from 1985 to 1999. There, he developed comprehensive economic forecasts and interpreted economic data for equity and fixed income portfolio managers. Also at Chancellor, Mr. Moeller worked as an equity analyst and was responsible for researching and rating companies in the economically sensitive automobile and housing industries for investment in Chancellor’s equity portfolio. Prior to joining Chancellor, Mr. Moeller was an Economist at Citibank from 1979 to 1984. He also analyzed pricing behavior in the metals industry for the Council on Wage and Price Stability in Washington, D.C. In 1999, Mr. Moeller received the award for most accurate forecast from the Forecasters' Club of New York. From 1990 to 1992 he was President of the New York Association for Business Economists. Mr. Moeller earned an M.B.A. in Finance from Fordham University, where he graduated in 1987. He holds a Bachelor of Arts in Economics from George Washington University.
More Economy in Brief


