 Global| Jul 02 2009
U.S. Light Vehicle Sales In June Hold A Steady, Sideways Movement
by:Tom Moeller
|in:Economy in Brief
Summary
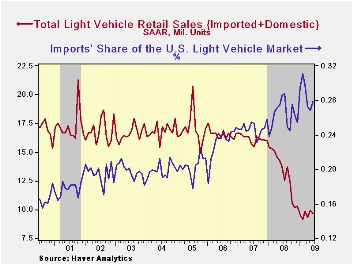
There's no breaking out from a sideways trend for sales of U.S. light vehicles. Certainly that was the case last month as unit vehicle sales slipped 2.3% during June to 9.69 million units (AR). That followed a 6.4% rise during May. [...]
 There's no
breaking out from a sideways trend for sales of U.S. light vehicles.
Certainly that was the case last month as unit vehicle sales slipped
2.3% during June to 9.69 million units (AR). That followed a 6.4% rise
during May. Since February vehicle sales have risen all of 11.7% (3.0%
since January) and recouped just a fraction of last year's 35.6%
decline from December-to-December.
There's no
breaking out from a sideways trend for sales of U.S. light vehicles.
Certainly that was the case last month as unit vehicle sales slipped
2.3% during June to 9.69 million units (AR). That followed a 6.4% rise
during May. Since February vehicle sales have risen all of 11.7% (3.0%
since January) and recouped just a fraction of last year's 35.6%
decline from December-to-December.
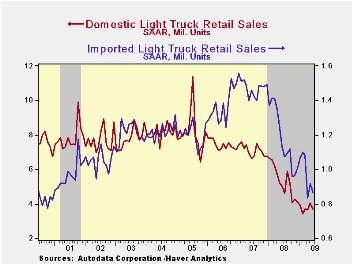
Unit sales of U.S. made light vehicles fell 3.7% to 6.99M units and remained near the lowest since 1982 according to the Autodata Corporation and Ward's Automotive News. (Seasonal adjustment of the figures is provided by the U.S. Bureau of Economic Analysis). Sales of domestically made light trucks fell 7.3% last month to 3.71M units while auto sales ticked up 0.8% m/m to 3.27M units. Sales of domestic vehicles YTD are down 17.3% following last year's 35.3% flop from December-to-December.
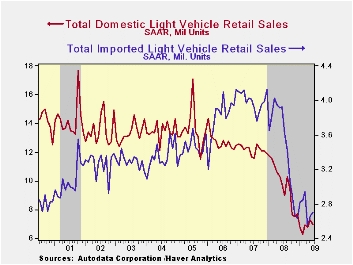 Imported
light vehicle sales
were a bit firmer and posted a 1.5% m/m June increase. Working the
other way versus domestic sales they are up 5.8% year-to-date after the
36.4% 2008 decline. Nevertheless, sales at 2.70M units remained near
their lowest level in roughly ten years. June sales of imported autos
rose 5.1% and were up by more than one-quarter from the December low
while sales of imported light trucks fell 5.3% and gave back most of a
May increase. Sales of imported vehicles YTD have increased 5.8% but
they more than halved last year Dec./Dec.
Imported
light vehicle sales
were a bit firmer and posted a 1.5% m/m June increase. Working the
other way versus domestic sales they are up 5.8% year-to-date after the
36.4% 2008 decline. Nevertheless, sales at 2.70M units remained near
their lowest level in roughly ten years. June sales of imported autos
rose 5.1% and were up by more than one-quarter from the December low
while sales of imported light trucks fell 5.3% and gave back most of a
May increase. Sales of imported vehicles YTD have increased 5.8% but
they more than halved last year Dec./Dec.
 Overall,
import's share of the U.S. light vehicle market increased to
27.9% last month after reaching 26.3% during all of last year.
(Imported vehicles are those produced outside the United States.)
Imports' share of the U.S. car market totaled 35.9%, up slightly from
the 2008 average, while the share of the light truck market was 18.9%,
roughly equal to last year.
Overall,
import's share of the U.S. light vehicle market increased to
27.9% last month after reaching 26.3% during all of last year.
(Imported vehicles are those produced outside the United States.)
Imports' share of the U.S. car market totaled 35.9%, up slightly from
the 2008 average, while the share of the light truck market was 18.9%,
roughly equal to last year.
The U.S. vehicle sales figures can be found in Haver's USECON database.
A View of the Economic Crisis and the Federal Reserve’s Response is yesterday's speech by Janet L. Yellen, President of the Federal Reserve Bank of San Francisco and it can be found here.
| Light Vehicle Sales (SAAR, Mil. Units) | June | May | April | June Y/Y | 2008 | 2007 | 2006 |
|---|---|---|---|---|---|---|---|
| Total | 9.69 | 9.91 | 9.32 | -29.2% | 13.17 | 16.16 | 16.54 |
| Autos | 5.11 | 4.99 | 4.81 | -31.9 | 6.71 | 7.58 | 7.77 |
| Domestic | 3.27 | 3.25 | 3.11 | -30.5 | 4.42 | 5.07 | 5.31 |
| Imported | 1.83 | 1.74 | 1.70 | -34.3 | 2.29 | 2.52 | 2.45 |
| Light Trucks | 4.58 | 4.92 | 4.51 | -25.9 | 6.47 | 8.60 | 8.78 |
| Domestic | 3.71 | 4.01 | 3.67 | -26.5 | 5.29 | 7.10 | 7.42 |
| Imported | 0.87 | 0.91 | 0.84 | -23.3 | 1.18 | 1.47 | 1.37 |

Tom Moeller
AuthorMore in Author Profile »Prior to joining Haver Analytics in 2000, Mr. Moeller worked as the Economist at Chancellor Capital Management from 1985 to 1999. There, he developed comprehensive economic forecasts and interpreted economic data for equity and fixed income portfolio managers. Also at Chancellor, Mr. Moeller worked as an equity analyst and was responsible for researching and rating companies in the economically sensitive automobile and housing industries for investment in Chancellor’s equity portfolio. Prior to joining Chancellor, Mr. Moeller was an Economist at Citibank from 1979 to 1984. He also analyzed pricing behavior in the metals industry for the Council on Wage and Price Stability in Washington, D.C. In 1999, Mr. Moeller received the award for most accurate forecast from the Forecasters' Club of New York. From 1990 to 1992 he was President of the New York Association for Business Economists. Mr. Moeller earned an M.B.A. in Finance from Fordham University, where he graduated in 1987. He holds a Bachelor of Arts in Economics from George Washington University.
More Economy in Brief


