 Global| Dec 17 2009
U.S. Leading Economic Indicators Rise Again Signaling Positive Growth
by:Tom Moeller
|in:Economy in Brief
Summary
The Conference Board's Index of Leading Economic Indicators continued its uptrend last month giving a strong signal that the recent recession has ended. The 0.9% rise during November was the eighth consecutive monthly increase. [...]
The Conference Board's Index of Leading Economic Indicators continued its uptrend last month giving a strong signal that the recent recession has ended. The 0.9% rise during November was the eighth consecutive monthly increase. Moreover, the 10.2% (centered) rate of increase during the last six months was nearly the strongest since early-1983. The leading index is based on actual reports for eight economic data series. The Conference Board initially estimates two series, consumer and capital goods orders.
The breadth of increase amongst the component series sagged again last month. Sixty-five percent of the components rose during November versus last month's reading of 70% that increased. During the most recent six months, however, 80% of the series rose. Prominent in last month's increase was a longer workweek, fewer jobless insurance claims, more building permits, and the steeper interest rate yield curve. These gains were offset by easier vendor performance, lower consumer expectations and a downtick in capital goods orders.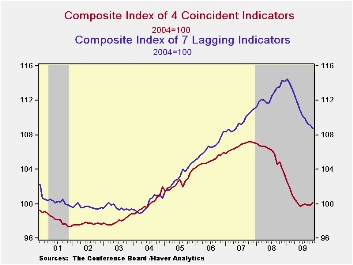
Continuing to suggest that the rate of decline in the economy is slowing were the coincident indicators which rose for the first month in the last three. The 0.2% gain followed an unrevised no-change during October. During the last six months the 1.4% rate of decline in the coincident series compares with a shortfall of 8.0% at its worst in January. Moderation of earlier declines has been due to higher industrial production, higher real personal income and higher business sales as well as easier declines in payroll employment.
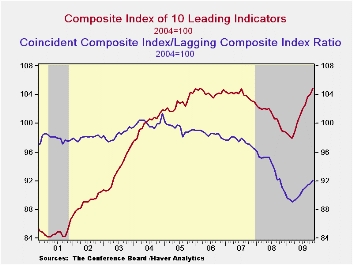
In a continued sign that excesses in the U.S. economy are falling, the lagging index has been falling since January. Leading the decline has been lower commercial & industrial loans outstanding as well as slower growth in labor costs and less consumer credit. The ratio of coincident-to-lagging indicators (another leading indicator) also continued higher for the eighth straight month to the highest level since November.The Conference Board figures are available in Haver's BCI database. Visit the Conference Board's site for coverage of leading indicator series from around the world.
| Business Cycle Indicators (%) | November | October | September | August 6-Month % (AR) | 2008 | 2007 | 2006 |
|---|---|---|---|---|---|---|---|
| Leading | 0.9 | 0.3 | 1.2 | 10.2 | -2.8 | -0.3 | 1.5 |
| Coincident | 0.2 | 0.0 | -0.1 | -1.4 | -0.9 | 1.6 | 2.5 |
| Lagging | -0.4 | -0.2 | -0.5 | -6.3 | 2.9 | 2.8 | 3.3 |

Tom Moeller
AuthorMore in Author Profile »Prior to joining Haver Analytics in 2000, Mr. Moeller worked as the Economist at Chancellor Capital Management from 1985 to 1999. There, he developed comprehensive economic forecasts and interpreted economic data for equity and fixed income portfolio managers. Also at Chancellor, Mr. Moeller worked as an equity analyst and was responsible for researching and rating companies in the economically sensitive automobile and housing industries for investment in Chancellor’s equity portfolio. Prior to joining Chancellor, Mr. Moeller was an Economist at Citibank from 1979 to 1984. He also analyzed pricing behavior in the metals industry for the Council on Wage and Price Stability in Washington, D.C. In 1999, Mr. Moeller received the award for most accurate forecast from the Forecasters' Club of New York. From 1990 to 1992 he was President of the New York Association for Business Economists. Mr. Moeller earned an M.B.A. in Finance from Fordham University, where he graduated in 1987. He holds a Bachelor of Arts in Economics from George Washington University.
More Economy in Brief


