 Global| Mar 02 2009
U.S. January Personal Savings Rate Highest Since 1995
by:Tom Moeller
|in:Economy in Brief
Summary
The personal & outlays report from the U.S. Bureau of Economic Analysis indicated that the savings rate continued its recent improvement. During January, individuals pared spending against the background of the current economic [...]
The personal & outlays report from the U.S. Bureau of Economic Analysis indicated that the savings rate continued its recent improvement. During January, individuals pared spending against the background of the current economic uncertainties and the personal savings rate rose to 5.0%, up from the monthly low of 0.0% reached last April. The saving rate averaged less than 1.0% from 2005 to 2007.
The personal income & consumption figures are available in Haver's USECON and USNA databases.
Life expectancy and old age savings from the Federal Reserve Bank of Chicago can be found here
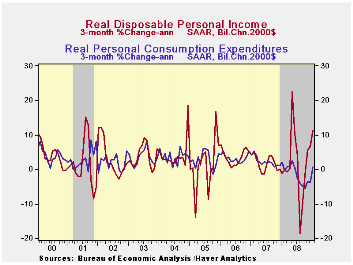
Personal consumption expenditures did rise last month, but the 0.6% increase was the first monthly increase since last June. The figure was slightly better than expectations for a 0.4% increase. Nevertheless, the three-month annualized rate of growth of -4.9% followed even more negative growth rates during the prior three months. The recent figures have been very much influenced by the change in energy prices. Real personal spending rose 0.4% during January and three-month growth amounted to 0.7%. The latest monthly increase was only the second since May.
Real spending on discretionary items continued weak. Motor
vehicle & parts purchases fell 0.8% in January after a 13.3%
decline during all of last year. Real spending on household furniture
& appliances rose a moderate 0.6% and it has been flat since
last summer while real spending on apparel fell 0.5% (-2.7%
year-to-year.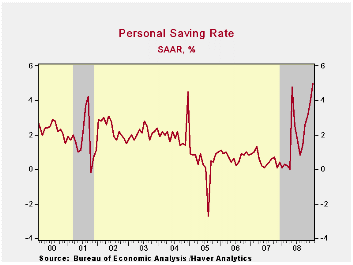
The pullback in personal spending continues to reflect the weakness in personal income. Though it rose 0.4% last month, it was the first monthly increase since September and the three month growth rate stood at -1.0%. The latest monthly figure was better than expectations for a 0.2% monthly decline. Disposable personal income also firmed and rose 1.7% last month (4.0% y/y) thanks to a 9.3% monthly drop in taxes. Real disposable income growth increased by 1.5% last month (3.3% y/y).
Wages & salaries continued to move lower last month. Declines in employment levels dropped wage income by 0.2% during January and at a 3.3% rate during the last three months. That was the weakest growth rate since 2004. Private sector wages fell at a 5.2% rate during those three months while government sector wages remained immune to the recession and rose at a 5.9% annual rate.
Lower interest rates caused another decline in interest income which is down at a 17.6% annual rate during the last three months. Dividend income also fell at a 3.7% annual rate during that three-month period as corporate profits fell.
The PCE chain price index continued to reflect the weakness in income & spending and rose just 0.2%. Prices rose 0.7% year-to-year, held back by the decline in energy prices. Core power logged just a 0.1% rise following the slight decline in December. The dip matched Consensus expectations. Durable goods prices fell 0.1% (-1.9% y/y).
The U.S. Treasury and Federal Reserve Board Announce Participation in AIG Restructuring Plan can be found here.
| Disposition of Personal Income (%) | January | December | Y/Y | 2008 | 2007 | 2006 |
|---|---|---|---|---|---|---|
| Personal Income | 0.4 | -0.2 | 1.9 | 3.8 | 6.1 | 7.1 |
| Disposable Personal Income | 1.7 | -0.2 | 4.0 | 4.7 | 5.5 | 6.4 |
| Personal Consumption Expenditures | 0.6 | -1.0 | -1.0 | 3.6 | 5.5 | 5.9 |
| Saving Rate | 5.0 | 3.9 | 0.1 (Jan. 08) | 1.8 | 0.5 | 0.7 |
| PCE Chain Price Index | 0.2 | -0.5 | 0.7 | 3.3 | 2.6 | 2.8 |
| Less food & energy | 0.1 | -0.0 | 1.6 | 2.2 | 2.2 | 2.3 |
by Tom Moeller March 2, 2009
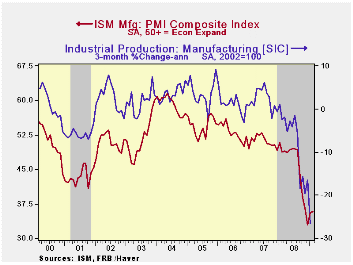
For February, the Institute for Supply Management (ISM) reported that its Composite Index of Activity in the manufacturing sector remained about unchanged at 35.8 versus the 35.6 January reading. The latest was still near the lowest level since the recession year of 1980. The break-even level for this diffusion index of factory sector activity is a level of 50.
During the last twenty years there has been a 72% correlation
between the level of the Composite Index and the three-month growth in
factory sector industrial production. The latest reading of the
composite index suggests that the recent 10% rate of decline in
industrial output will continue.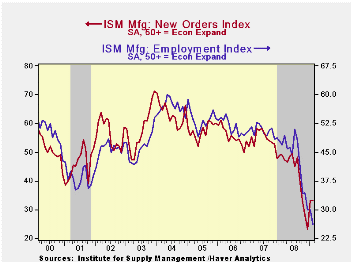
It is appropriate to correlate the ISM index level with factory sector growth because the ISM index is a diffusion index. It measures growth by using all of the positive changes in activity added to one half of the zero change in activity measures.
The separate index of prices paid also was unchanged from January and still barely above the lowest level since 1949. During the last twenty years there has been a 79% correlation between the price index and the three-month change in the PPI for intermediate goods.
The February new orders index was about unchanged from January as 13% of survey participants reported higher orders but 44% reported that orders fell. The export order index also was unchanged as economic weakness outside of the U.S. continued. It was still near the lowest level in this index's short twenty year history. During the last ten years there has been a 53% correlation between the index and the q/q change in real exports of goods in the GDP accounts.
The ISM data is available in Haver's USECON database.
| ISM Mfg | February | January | February '08 | 2008 | 2007 | 2006 |
|---|---|---|---|---|---|---|
| Composite Index | 35.8 | 35.6 | 48.8 | 45.5 | 51.1 | 53.1 |
| New Orders Index | 33.1 | 33.2 | 48.9 | 42.1 | 54.3 | 55.4 |
| Employment Index | 26.1 | 29.9 | 47.0 | 43.2 | 50.5 | 51.7 |
| Prices Paid Index (NSA) | 29.0 | 29.0 | 75.5 | 66.5 | 64.6 | 65.0 |
by Robert Brusca March 2, 2009
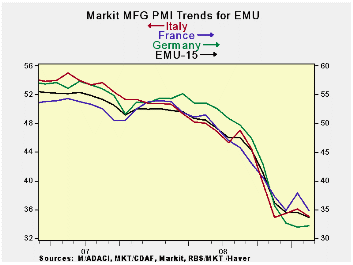
Despite the slippage some consolidation is evident.
Germany Spain and Austria were among the ground hogs that left
their heads in February and did not scurry lower for the winter. There,
MFG PMIs managed to stay higher even though for most of the region
manufacturing was seeing darker days in February. France, a country
that had been holding off the declines succumbed in February with its
MFG index dropping to 34.81 from 37.90; Ireland’s MFG sector made a
similarly large drop. EMU as a whole, France, Ireland and The
Netherlands this month sport MFG PMI readings that are the lowest ever.
The UK, Italy and Germany each are less than 1% up from their
respective lows. To be sure it remains a very weak February for
European manufacturing. But the good news is that the downturn is NOT
getting worse in several key countries and that the pace of
deterioration where things are unraveling is largely slowing. France
and Ireland are to be taken as notable exceptions. Looks like the Irish
have run out of luck and the French continue to buck the trends to
which everyone else is subject.
| NTC/Markit MFG Indices | |||||||
|---|---|---|---|---|---|---|---|
| Feb-09 | Jan-09 | Dec-08 | 3Mo | 6Mo | 12Mo | Percentile | |
| Euro-13 | 33.55 | 34.42 | 33.87 | 33.95 | 37.25 | 43.41 | 0.0% |
| Germany | 32.14 | 31.96 | 32.66 | 32.25 | 37.11 | 44.84 | 0.7% |
| France | 34.81 | 37.90 | 34.91 | 35.87 | 38.08 | 43.75 | 0.0% |
| Italy | 34.99 | 36.06 | 35.54 | 35.53 | 37.61 | 42.55 | 0.2% |
| Spain | 31.85 | 31.51 | 28.49 | 30.62 | 32.37 | 37.65 | 11.7% |
| Austria | 34.58 | 33.12 | 35.01 | 34.24 | 38.40 | 43.95 | 5.7% |
| Ireland | 33.20 | 38.94 | 37.87 | 36.67 | 38.42 | 41.62 | 0.0% |
| Netherlands | 35.47 | 36.29 | 38.42 | 36.73 | 40.41 | 45.62 | 0.0% |
| EU | |||||||
| UK | 34.68 | 35.79 | 34.94 | 35.14 | 36.94 | 42.26 | 0.2% |
| percentile is over range since March 2000 | |||||||
by Louise Curley March 2, 2009
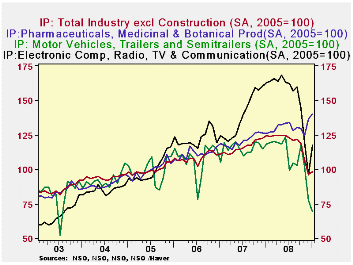
Industrial production in South Korea increased 1.35% in
January, the first increase in four months. However, compared to a year
ago, the unadjusted index is down some 25%. Production of motor
vehicles continues to be the biggest drag with production down more
than 10% in January and down over 40% from a year ago. Production in
Electronic equipment and devices increased 22% in January, but was
still 32% below the year ago figure. Production in the Pharmaceuticals,
medical chemicals and botanical products industry was up only 2.5% in
January, but production in this industry has held relatively steady
and, although only 4% above January 2007,it is one of the few
industries where production is greater than a year ago. These four
indexes are shown in the first chart.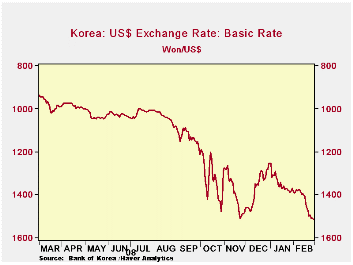
Data on international trade in goods in US dollars and Korean won were released yesterday. The Bank of Korea publishes balance of payments data in USD and much of the discussion of Korea's trade takes place in USD terms. However, for domestic considerations the won data may be more relevant. The two series can differ significantly when there is a substantial appreciation or depreciation in the won. For example, in February seasonally unadjusted data on exports in USD show a year to year decline of 17%, while the seasonally unadjusted data in won show and increase of 26%. The difference is due to the change that has taken place in the won over the year. As can be seen in the third chart which shows the won versus the USD on an inverted scale, the won has depreciated substantially over the past year. As a result, the increase in exports in yen, when converted to USD, turn into a decline. Recent data are shown in the table below.
| SOUTH KOREA | Jan 09 | Dec 08 | Nov 08 | Oct 08 | Sep 08 |
|---|---|---|---|---|---|
| Industrial Production (2005=100) | |||||
| Total | 97.9 | *6.6 | 106.8 | 118.8 | 121.9 |
| Pharmaceuticals, medical chemicals and botanic products | 140.1 | 136.7 | 124.6 | 129.5 | 130.7 |
| Motor Vehicles | 69.2 | 77.5 | 102.2 | 117.2 | 103.3 |
| Electronic equipment and devices | 117.2 | 96.2 | 119.8 | 143.9 | 159.9 |
| Total | Feb 09 | Jan 09 | Dec 08 | Nov 08 | Oct 08 |
| Y/Y % Change in Yen Exports | 25.55 | -4.83 | 20.06 | 22.61 | 56.57 |
| Y/Y % Change in Yen Depreciation | 52.50 | 43.70 | 42.03 | 52.57 | 45.05 |
| Y/Y $ Change in USD Exports | -17.67 | -33.76 | -18.36 | -19.64 | 7.94 |

Tom Moeller
AuthorMore in Author Profile »Prior to joining Haver Analytics in 2000, Mr. Moeller worked as the Economist at Chancellor Capital Management from 1985 to 1999. There, he developed comprehensive economic forecasts and interpreted economic data for equity and fixed income portfolio managers. Also at Chancellor, Mr. Moeller worked as an equity analyst and was responsible for researching and rating companies in the economically sensitive automobile and housing industries for investment in Chancellor’s equity portfolio. Prior to joining Chancellor, Mr. Moeller was an Economist at Citibank from 1979 to 1984. He also analyzed pricing behavior in the metals industry for the Council on Wage and Price Stability in Washington, D.C. In 1999, Mr. Moeller received the award for most accurate forecast from the Forecasters' Club of New York. From 1990 to 1992 he was President of the New York Association for Business Economists. Mr. Moeller earned an M.B.A. in Finance from Fordham University, where he graduated in 1987. He holds a Bachelor of Arts in Economics from George Washington University.
More Economy in Brief


