 Global| Feb 04 2009
U.S. ISM Nonmanufacturing Index Moved Higher Again
by:Tom Moeller
|in:Economy in Brief
Summary
The January Composite Index for the nonmanufacturing sector from the Institute for Supply Management (ISM) rose for the second consecutive month. The rise to 42.9 raised the level to its highest since October and it was much firmer [...]
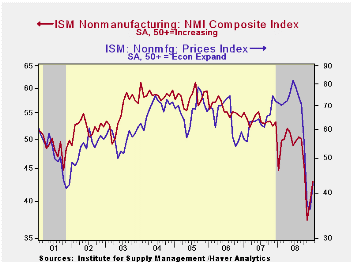
The January Composite Index for the nonmanufacturing sector from the Institute for Supply Management (ISM) rose for the second consecutive month. The rise to 42.9 raised the level to its highest since October and it was much firmer than Consensus expectations for a reading of 39.0. A level of the ISM indices below 50 indicates declining activity. Since the series' inception in 1997 there has been a 48% correlation between the level of the business activity index for the nonmanufacturing sector and the Q/Q change in real GDP for the services and the construction sectors.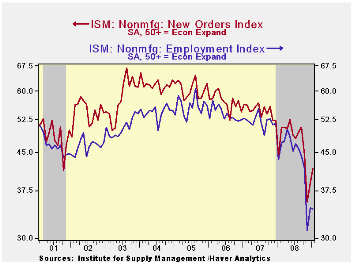
The rise in the overall figure last month was led by improvement in the business activity sub-component, also its highest since October. The new orders sub-index increased as well to 41.6.
The employment index was relatively less robust and was about unchanged from December at 34.4, but that was still up moderately from the November low. Since the series' inception in 1997 there has been a 56% correlation between the level of the ISM nonmanufacturing employment index and the m/m change in payroll employment in the service-producing plus the construction industries.
Pricing power firmed as well to a reading of 42.5 which was the highest since October. Since its inception ten years ago, there has been a 60% correlation between the price index and the q/q change in the GDP services chain price index.Beginning with the January 2008 Nonmanufacturing Report On Business®, the composite index is calculated as an indicator of the overall economic condition for the non-manufacturing sector. It is a composite index based on the diffusion indexes for four of the indicators (business activity, new orders, employment and supplier deliveries) with equal weights. The latest report from the ISM can be found here.
ISM surveys more than 370 purchasing managers in more than 62 industries including law firms, hospitals, government and retailers. The nonmanufacturing survey dates back to July 1997.
| ISM Nonmanufacturing Survey | January | December | January '08 | 2008 | 2007 | 2006 |
|---|---|---|---|---|---|---|
| Composite Index | 42.9 | 40.1 | 44.6 | 47.4 | 53.5 | 55.7 |
| Prices Index | 42.5 | 36.1 | 71.2 | 66.0 | 63.8 | 65.3 |

Tom Moeller
AuthorMore in Author Profile »Prior to joining Haver Analytics in 2000, Mr. Moeller worked as the Economist at Chancellor Capital Management from 1985 to 1999. There, he developed comprehensive economic forecasts and interpreted economic data for equity and fixed income portfolio managers. Also at Chancellor, Mr. Moeller worked as an equity analyst and was responsible for researching and rating companies in the economically sensitive automobile and housing industries for investment in Chancellor’s equity portfolio. Prior to joining Chancellor, Mr. Moeller was an Economist at Citibank from 1979 to 1984. He also analyzed pricing behavior in the metals industry for the Council on Wage and Price Stability in Washington, D.C. In 1999, Mr. Moeller received the award for most accurate forecast from the Forecasters' Club of New York. From 1990 to 1992 he was President of the New York Association for Business Economists. Mr. Moeller earned an M.B.A. in Finance from Fordham University, where he graduated in 1987. He holds a Bachelor of Arts in Economics from George Washington University.
More Economy in Brief


