 Global| Jun 01 2010
U.S. ISM Index Indicates Topping Of Factory Sector Growth
by:Tom Moeller
|in:Economy in Brief
Summary
Rising trends don't have unending momentum. And the current rebound in factory sector activity appears to be no exception. The Institute for Supply Management indicated that their May composite index of factory sector activity slipped [...]
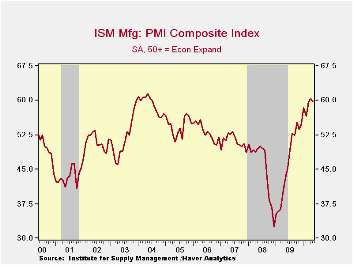
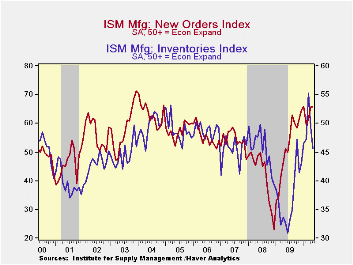
Rising trends don't have unending momentum. And the current rebound in factory sector activity appears to be no exception. The Institute for Supply Management indicated that their May composite index of factory sector activity slipped to 59.7 from 60.4 in April. While May's figure was higher than Consensus expectation's for a decline to 59.0, recent levels have been historically hard to sustain. Still, the latest figure is up from the low of 32.5 reached in December '08. (Any figure above the break-even point of 50 suggests rising activity.) The ISM data is available in Haver's USECON database.
A slower rate of inventory accumulation was the main source of the composite index's May weakness. The new orders, production and vendor performance components were roughly unchanged. Notable, however, was the slight gain in the employment index to 59.8. It was the highest level since early-2004. During the last ten years there has been an 89% correlation between the ISM employment index and the m/m change in factory sector payrolls.
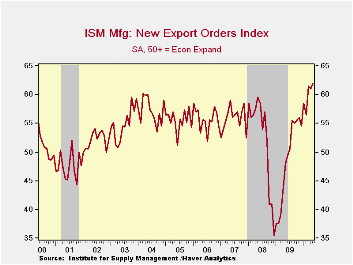
Also showing lift was the separate index of export orders to 62.0 which was the highest level since 1988. During the last ten years there has been an 88% correlation between the level of the index and the quarterly change in merchandise exports. Twenty-eight percent of respondents reported higher export orders while fourteen reported lower orders.
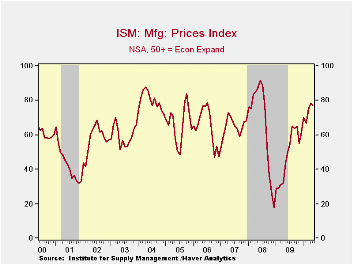
The separate index of prices paid slipped to 77.5 from its high for this recovery. It remained up from the December '08 low of 18.0. Sixty percent of respondents reported higher prices while only 5% indicated lower prices. During the last twenty years there has been an 83% correlation between the price index and the three-month change in the PPI for intermediate goods.
The ISM data are available in Haver's USECON database.
The Policy Response to the Crisis in Korea and Other Emerging Market Economies is Saturday's speech by Fed Chairman Ben S. Bernanke and it can be found here.
| ISM Mfg | May | April | March | May '09 | 2009 | 2008 | 2007 |
|---|---|---|---|---|---|---|---|
| Composite Index | 59.7 | 60.4 | 59.6 | 43.2 | 46.2 | 45.5 | 51.1 |
| New Orders | 65.7 | 65.7 | 61.5 | 51.4 | 51.6 | 42.1 | 54.3 |
| Employment | 59.8 | 58.5 | 55.1 | 35.1 | 40.5 | 43.3 | 50.5 |
| Production | 66.6 | 66.9 | 61.1 | 47.0 | 50.4 | 45.2 | 54.1 |
| Supplier Deliveries | 61.0 | 61.3 | 64.9 | 50.0 | 51.4 | 51.6 | 51.2 |
| Inventories | 45.6 | 49.4 | 55.3 | 32.7 | 37.1 | 45.5 | 45.4 |
| Prices Paid Index (NSA) | 77.5 | 78.0 | 75.0 | 43.5 | 48.3 | 66.5 | 64.6 |
by Robert Brusca June 1, 2010
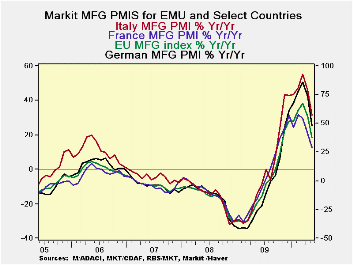
The market MFG barometers for EMU fell across the bard in May. Only Ireland among the main reports showed a month-to-month boost and the EU’s UK edged higher. Greece the well-know troubled EMU ember shows what troubled straits it is in as it is the only example of a MFG PMI that is down over three-, six- and twelve-months. Moreover, every other EU/EMU report in the table is up by 20 index points (or almost) from its respective cycle low. Greece is not. Notably Greece’s MFG index is up by just 3.6 points from its low. The whole of the e-Zone is not even down that much from its cycle peak! Greece’s problems are not just problems with debt but are about problems in getting economic growth going and improving its tax revenues. The manufacturing sector has been leading EMU into recovery.
Today EMU unemployment was reported and it ticked up by 0.1%. In Germany the rate fell and the number unemployed fell by more than expected as Greece’s woes are helping German growth by having knocked down the value of the euro. Germany is benefitting from export strength. Still it is well recognized that Greece’s problems could become a net negative for the Zone. And, of course, Greece is not the only thing Europe is worried about.
Spain was downgraded by Fitch just before the weekend at the end of the US trading day. Over the weekend the ECB released estimates for the first time on the amount of bank loan losses that the Zone’s banking system probably faces. The ECB pointed to 195bln euros in loan losses for 2010 and 2011 saying that it could be worse if growth were hit hard. Add to this to the news of China slowing and we have a US-holiday shortened week that has just begun and already is jam-packed full of negative news. Welcome back!
| Changes in Markit MFG Indices | ||||||||
|---|---|---|---|---|---|---|---|---|
| Changes Mo/Mo | Change on Frequency | |||||||
| May-10 | Apr-10 | Mar-10 | 3Mo | 6Mo | 12Mo | From Peak | From Low | |
| Euro-13 | -1.69 | 0.90 | 2.42 | 1.63 | 4.66 | 15.18 | -2.9 | 22.3 |
| Germany | -3.14 | 1.34 | 3.02 | 1.22 | 5.99 | 18.85 | -3.1 | 26.5 |
| France | -0.77 | 0.08 | 1.59 | 0.90 | 1.38 | 12.46 | -8.2 | 21.0 |
| Italy | -0.28 | 0.57 | 2.10 | 2.39 | 3.93 | 12.91 | -3.6 | 19.4 |
| Spain | -1.80 | 1.46 | 2.75 | 2.41 | 6.23 | 11.68 | -5.7 | 23.0 |
| Austria | -2.11 | 3.62 | 1.31 | 2.82 | 8.29 | 18.92 | -2.1 | 25.1 |
| Greece | -1.85 | 0.71 | -1.26 | -2.40 | -5.45 | -4.28 | -14.2 | 3.6 |
| Ireland | 0.67 | 0.42 | 4.35 | 5.44 | 5.29 | 14.73 | -1.3 | 20.9 |
| EU | ||||||||
| UK | 0.02 | 0.69 | 0.67 | 1.38 | 5.38 | 12.92 | 0.0 | 22.8 |
| percentile is over range since March 2000 | ||||||||
by Tom Moeller June 1,2010
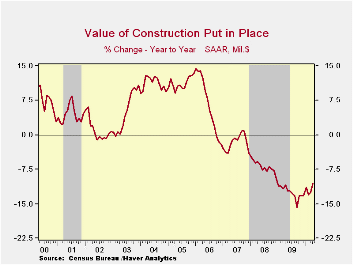
Perhaps busting out of its malaise, construction activity rebounded a sharp 2.7% during April after a 0.4% March uptick. The latest increase vastly exceeded Consensus expectations for a 0.1% uptick. The impetus for the April rise was a 2.9% jump in private sector building off the March low. Nevertheless, private sector building was off 13.5 y/y and 41.2% from the early-2006 high.
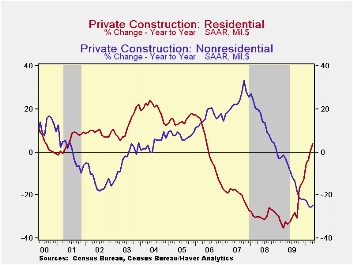
Higher residential building activity provided the impetus behind the gain in the total with a 4.4% increase. A 6.3% jump (2.7% y/y) in spending on home improvements led the April gain. It was followed by single-family construction activity which rose 3.4% rise (29.0% y/y) and was the eleventh consecutive monthly increase. It lifted activity by more than one-third from last year's low. However, building remained off three-quarters from the 2006 high. Multi-family building fell another 1.9% during April to a new series' low (-57.4% y/y).
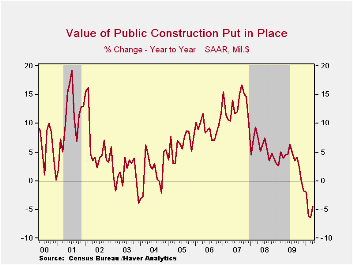
Nonresidential building activity also recovered 1.7%, though that was the cycle's first meaningful monthly gain. Since the 2008 peak, activity has fallen by 29.0%. Higher factory sector building led the April gain with a 2.7 increase (-31.3% y/y) followed by a 1.3% rise (-15.7% y/y) in health-care building. Office building (-36.4% y/y) and educational construction (-16.6% y/y) both fell sharply. In the public sector, building activity also firmed by 2.4% (-4.4% y/y) led by a 3.6% jump in spending on highways & streets (5.1% y/y).
The construction put-in-place figures are available in Haver's USECON database.
Policy Challenges for Central Banks in the Aftermath of the Crisis is last week's speech by St. Louis Fed President James Bullard and it can be found here here.
| Construction Put In Place (%) | April | March | February | Y/Y | 2009 | 2008 | 2007 |
|---|---|---|---|---|---|---|---|
| Total | 2.7 | 0.4 | -2.4 | -10.5 | -12.5 | -6.9 | -1.6 |
| Private | 2.9 | -0.5 | -2.9 | -13.5 | -18.8 | -11.1 | -5.7 |
| Residential | 4.4 | 0.0 | -4.4 | 4.1 | -28.0 | -29.1 | -19.7 |
| Nonresidential | 1.7 | -0.9 | -1.7 | -24.6 | -11.1 | 13.2 | 23.1 |
| Public | 2.4 | 2.0 | -1.3 | -4.4 | 3.3 | 5.6 | 13.1 |
Tom Moeller
AuthorMore in Author Profile »Prior to joining Haver Analytics in 2000, Mr. Moeller worked as the Economist at Chancellor Capital Management from 1985 to 1999. There, he developed comprehensive economic forecasts and interpreted economic data for equity and fixed income portfolio managers. Also at Chancellor, Mr. Moeller worked as an equity analyst and was responsible for researching and rating companies in the economically sensitive automobile and housing industries for investment in Chancellor’s equity portfolio. Prior to joining Chancellor, Mr. Moeller was an Economist at Citibank from 1979 to 1984. He also analyzed pricing behavior in the metals industry for the Council on Wage and Price Stability in Washington, D.C. In 1999, Mr. Moeller received the award for most accurate forecast from the Forecasters' Club of New York. From 1990 to 1992 he was President of the New York Association for Business Economists. Mr. Moeller earned an M.B.A. in Finance from Fordham University, where he graduated in 1987. He holds a Bachelor of Arts in Economics from George Washington University.


