 Global| May 14 2009
U.S. Initial Weekly Claims ForJobless Insurance Rebound But Still Trending Lower
by:Tom Moeller
|in:Economy in Brief
Summary
A stutter-step was taken by the U.S. job market last week. Initial claims for unemployment insurance increased 32,000 to 637,000 and that recovered all of the prior week's decline. Nevertheless, claims remained down sharply from their [...]
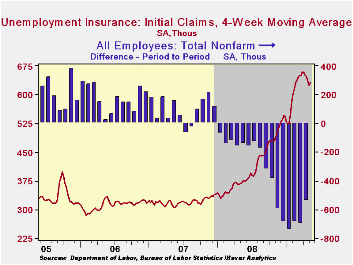
A stutter-step was taken by the U.S. job market last week. Initial claims for unemployment insurance increased 32,000 to 637,000 and that recovered all of the prior week's decline. Nevertheless, claims remained down sharply from their March high of 674,000. The four-week average of claims, which smoothes out some of the volatility in the weekly numbers, ticked up to 630,500, still near the lowest level since mid-February. Initial claims of 610,000 was the Consensus expectation for claims last week.
The Labor Department indicated that the largest increases in
initial claims for the week ending May 2 were in Illinois (+2,052),
Kansas (+2,025), Puerto Rico (+1,781), Indiana (+1,051), and Ohio
(+1,013), while the largest decreases were in New York (-13,386),
Michigan (-10,952), North Carolina (-8,988), Massachusetts (-3,705),
and Connecticut (-2,802).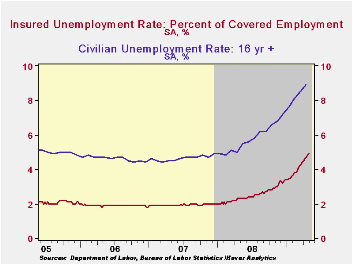
While initial claims for jobless insurance benefits have been trending higher around the country, the increases versus last year are quite notable in several states. Year-to-year, claims have roughly doubled in Texas, Michigan, Massachusetts, Maine, Ohio, New Hampshire, and Connecticut. In many other states claims have risen by one-half including New York, New Jersey, Pennsylvania, Washington, Maryland and Wisconsin.
Layoffs may have eased, but the pace of rehiring of unemployed workers remains depressed. Continuing claims for unemployment insurance increased again to another record high of 6,560,000 and they remain twice the year ago level. The series dates back to 1966. The four-week average of continuing claims also rose to another record of 6,337,250. Continuing claims provide some indication of workers' ability to find employment and they lag the initial claims figures by one week.
The lack of hiring continued to push the insured unemployment rate higher to 4.9%. That level was more than double last April and the highest level since 1983. During the last ten years there has been a 93% correlation between the level of the insured unemployment rate and the overall rate of unemployment published by the Bureau of Labor Statistics.Clearly, the latest weekly figure understates labor market distress in some states. The highest insured unemployment rates in the week ending April 25 were in Michigan (7.8 percent), Oregon (7.5), Pennsylvania (6.5), Wisconsin (6.4), Nevada (6.3), Idaho (6.1), Puerto Rico (5.9), Vermont (5.8), Alaska (5.7), and Rhode Island (5.7).
The unemployment insurance claim data is available in Haver's WEEKLY database. The state data is available in the REGIONAL database.
Comparing patterns of default among prime and subprime mortgages from the Federal Reserve Bank of Chicago is available here.
| Unemployment Insurance (000s) | 05/09/09 | 05/02/09 | 04/25/09 | Y/Y | 2008 | 2007 | 2006 |
|---|---|---|---|---|---|---|---|
| Initial Claims | 637 | 635 | 635 | 69.9% | 420 | 321 | 313 |
| Continuing Claims | -- | 6,560 | 6,358 | 114.2% | 3,342 | 2,552 | 2,459 |
by Tom Moeller May 14, 2009
 U.S.
producer prices for finished goods rose 0.3% last month following their
1.2% downdraft during March. The latest rise outpaced Consensus
expectations for a 0.1% uptick. It did not, however, represent a
broad-based firming of the recent weakness in pricing power. In fact
pricing power was very limited. · Finished food prices jumped
1.5% m/m led by firm gains in beef (-4.2% y/y) & vegetable
(1.3% y/y) prices as well as a notable 43.7% surge in egg prices (-4.0%
y/y). That surge was, however, just recovering declines during the
prior two months.
U.S.
producer prices for finished goods rose 0.3% last month following their
1.2% downdraft during March. The latest rise outpaced Consensus
expectations for a 0.1% uptick. It did not, however, represent a
broad-based firming of the recent weakness in pricing power. In fact
pricing power was very limited. · Finished food prices jumped
1.5% m/m led by firm gains in beef (-4.2% y/y) & vegetable
(1.3% y/y) prices as well as a notable 43.7% surge in egg prices (-4.0%
y/y). That surge was, however, just recovering declines during the
prior two months.
Energy prices ticked 0.1% lower (-25.2% y/y) after their 5.5% decline during March. Finished gasoline prices rose 2.6% which reversed just a piece of a 13.1% decline in March (-46.7% y/y). That monthly increase was offset, however, by a 6.2% decline in natural gas prices (-18.1% y/y).
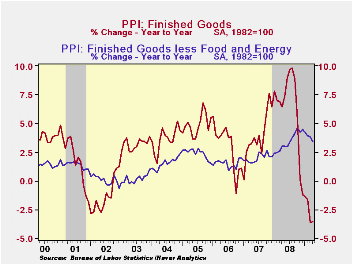
Prices of core finished consumer goods rose
another 0.2%. 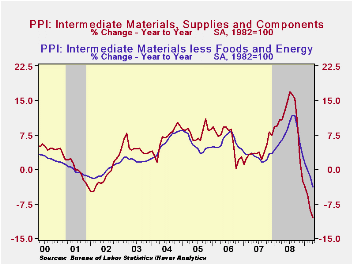 The gain
left the y/y increase at a respectable 3.8% but
the trend has been moving lower since the end of last year. Durable
consumer goods prices increased 0.3% after having been unchanged during
March but, here again, the trend rate of gain has eased. On a
three-month basis prices have risen at a 2.0% annual rate versus a 6.4%
rise last October. The three-month gain in core nondurable goods prices
also has eased to 3.4% (AR), half the peak rate of increase last fall.
Finally, capital equipment prices have started to fall. The April
decline of 0.1% added to a 0.2% March drop and that was enough to pull
the three-month change negative versus a 5%+ rate of increase as of
last fall.
The gain
left the y/y increase at a respectable 3.8% but
the trend has been moving lower since the end of last year. Durable
consumer goods prices increased 0.3% after having been unchanged during
March but, here again, the trend rate of gain has eased. On a
three-month basis prices have risen at a 2.0% annual rate versus a 6.4%
rise last October. The three-month gain in core nondurable goods prices
also has eased to 3.4% (AR), half the peak rate of increase last fall.
Finally, capital equipment prices have started to fall. The April
decline of 0.1% added to a 0.2% March drop and that was enough to pull
the three-month change negative versus a 5%+ rate of increase as of
last fall.
Falling again were prices for intermediate goods and that should foreshadow even lower finished goods prices. Intermediate goods prices dropped another 0.5% pulling the year-to-year change to still another record rate of decline of 10.4%. Excluding food & energy prices continued to move lower, last month by 0.9% which was their seventh monthly decline. Pricing here has been so weak that the 3.8% y/y decline was a record drop for the series which dates back to 1974.
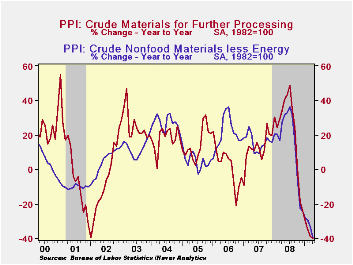 The crude
materials PPI prices rose for the first
month since last summer. The modest 3.0% rise reflected higher food
prices which still are down a sharp 18.7% y/y. Core pricing power
continued to reflect the weak economy and prices fell 0.6%. They
remained down by more than one-third versus last year due to lower
metals and chemicals prices.
The crude
materials PPI prices rose for the first
month since last summer. The modest 3.0% rise reflected higher food
prices which still are down a sharp 18.7% y/y. Core pricing power
continued to reflect the weak economy and prices fell 0.6%. They
remained down by more than one-third versus last year due to lower
metals and chemicals prices.
The Producer Price Index data is available in Haver's USECON database. More detailed data is in the PPI and in the PPIR databases.
Rethinking the Implications of Monetary Policy: How a Transactions Role for Money Transforms the Predictions of Our Leading Models from the Federal Reserve Bank of Philadelphia can be found here.
| Producer Price Index (%) | April | March | Y/Y | 2008 | 2007 | 2006 |
|---|---|---|---|---|---|---|
| Finished Goods | 0.3 | -1.2 | -3.5 | 6.4 | 3.9 | 2.9 |
| Core | 0.1 | 0.0 | 3.4 | 3.4 | 2.0 | 1.5 |
| Intermediate Goods | -0.5 | -1.5 | -10.4 | 10.5 | 4.0 | 6.4 |
| Core | -0.9 | -0.3 | -3.8 | 7.6 | 2.8 | 6.0 |
| Crude Goods | 3.0 | -0.3 | -39.9 | 21.2 | 11.9 | 1.4 |
| Core | -0.6 | -1.6 | -39.7 | 15.0 | 15.6 | 20.8 |
by Robert Brusca May 14, 2009
GDP: more reports coming - The bulk of the euro-countries’ GDP
reports will begin to be released on Friday. For now we have the Q/Q
number for Spain and a release for the UK (an EU member country) and a
comparison available to the US. France’s Finance Minister, Christine
Lagarde, is on record saying that the French GDP result will be ‘bad.’
She has not put a figure to that. Germany has been releasing results
and projections for tax revenues that increasingly are falling behind
what was anticipated, tipping off the weakness in German GDP. France is
headed to bust the Maastricht rules for fiscal deficits. Spain’s GDP
has made the largest quarterly drop and Yr/Yr drop in four decades as
its property boom gone-bust is taking its toll on the economy. Spain’s
4 million people out of work account for about 70% of the increase in
all of the euro area. And…Spain’s adjustment is still in progress.
Europe’s IP has been horrifically weak -- The large EMU
economies have already posted weak results for industrial output with
that sector showing declines at horrifically negative growth rates in
the first quarter, clustering around -30% annualized and ranging from
-25% to -45% here.
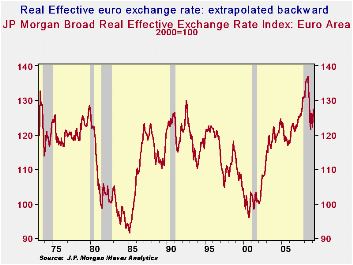
Euro FX rate is resilient - For all of that weakness the euro
exchange rate has held up pretty well and even advanced, reversing its
recent down cycle. The chart (above) shows the level of the EMU area’s
real effective exchanger rate up 25.5% from its year 2000 level. This
rate compares the euro’s many bilateral values compressing them to a
single number using trade-weights, (hence it is ‘effective’, or
‘multilateral’). It also accounts for inflation differences in doing so
(hence it is ‘real’). The euro is off peak but it is still strong.
Euro is still ‘strong’ -- Counting from all its monthly values
since 1973, the synthetic euro stands at about the 79Th percentile of
its range of values. The synthetic euro uses actual euro weighting
against non euro currencies and hypothetically calculates what the euro
exchange rate would have been had the EMU currency value arrangement
been in existence since 1973. On this basis the value of the euro is in
the top 20th percentile of its range. That is a relatively strong
showing, despite its recent backtracking.
Relativity has helped to stabilize the euro -- In April of
2008 the synthetic euro reached its ‘all time’ high for this same
period. It since has dropped and regained some momentum. While the euro
area remains quite weak with output still declining with vigor,
currency values are a relative thing. The rest of the world is
experiencing output declines as well. But the declines in US output,
plus the well-publicized banking problems and investment losses in
certain classes of dollar assets, have harmed the aura of security
surrounding the dollar and the US. In truth ‘the US’ has been more of
an issue than ‘the dollar.’
Relativity and perception - In fact, European banks are
troubled as well. I will not try and make any comparative statement on
their health. But international agencies are urging European
authorities to do more to help them. Germany has just taken steps to
bolster the Landesbanks and to set up a German ‘bad bank.’ In France
authorities have promised to back stop French banks. After the failure
of the US investment bank Lehman Brothers, the US has taken steps to
prop up banks as well although small- to moderate-sized banks have been
allowed to go out of business. Those are not usually the sorts of banks
that would affect overseas investors. A big issue for investors has
been the threat to Fannie Mae and Freddie Mac which they once saw as a
gold standard and from losses on various mortgage backed securities in
the US as well as to losses in equities and directly in real estate,
each of which has a more global dimension.
The Fed and monetary policy prospects: While the US dollar
remains backed by a careful and watchful US monetary policy the Fed’s
balance sheet has expanded greatly. US inflation is still tempered but
some harbor concerns about the future. The most recent rumblings come
from a Fed conference in Sea Island Georgia where John Taylor, inventor
of ‘The Taylor Rule,’ has suggested that, according to that rule, the
Fed is close to needing to hike rates.
Underpinning the dollar: Currencies are underpinned by their
central banks and the policies they follow, particularly when it comes
to inflation. The US central bank has undertaken to stock pile a hoard
of private sector assets as collateral as it has provided financial
assistance to the beleaguered US financial sector. In Europe the ECB
has just agreed to do the same to a much more modest extent overriding
German opposition within the ECB. Certainly the asset quality at the
central bank is an issue for the credit worthiness of the bank itself.
But the real issue is it what a bank’s policies mean for the evolution
of inflation. There, some see a link between this asset quality and
future inflation. Given the odd sort of business cycle we have had in
the US that point is much more debatable. For the moment that asset
quality issue favors the ECB and the euro. But does it really matter?
Private asset values matter too -- The asset price declines in
the US have been varied and, because more foreign money has been
invested in the US, more foreign investors have been burned on their
‘dollar’ exposures. While that is not a foreign exchange issue per se,
it is when viewed in a broader sense. Foreign money will not flow in
unless it has a place to be invested. Up to this point there has been
no other place to go other than to the US. More money has been lost in
US based investments than in dollar exposures- indeed the dollar has
risen since the crisis began. What is interesting is that there are
concerns about the dollar - even though we have not yet had dollar
problems attached to this crisis. The real concerns are about recycling
savings surpluses and those are not dollar issues per se.
Earlier experiences with ‘recycling of savings surpluses’ --
In the early 1970s surplus funds from OPECs price hikes went to banks
for recycling. They proved to be poor custodians as a binge of
international lending, much of it to Latin America, went bust. Next,
Japan’s surpluses helped to fuel a rise in US indebtedness and a global
stock market boom until the turn off the century. The fallout from that
was a rise in the yen that eviscerated Japan’s competitiveness that
thrust it into a lost decade of growth while Japan outsourced to regain
its industrial standing. The recent recycling was funneled more
directly though various securities markets (not just equity markets) as
China’s surpluses grew then as oil prices jolted savings in OEPC and
other oil-producing countries. The consequences again have been
devastating. Perhaps the lesson here is more about sudden international
shifts in savings imbalances than about currencies and the dollar in
particular. So far the dollar has weathered the storm well and has even
risen in value. The real problem for the global financial system and
its financial intermediaries has been the inability to weather sudden
shifts in various national savings rates be they in OPEC nations,
China, Japan or elsewhere. (In the case of Japan is was more a case of
a shift of funds on the margin to a country with an already high saving
rate.)
Europe: better or just less exposed? Had relatively more
international funds been invested in Germany or in France in this cycle
similar losses would have been experienced there since real estate and
asset prices have declines there more or less in step with the losses
in the US. But since the US was amore advanced in securitization, that
market lent itself more readily to an influx of foreign investors who
now must deal with the consequences.
Outlook: Looking ahead the issue for the euro’s value is going
to be much more about growth, inflation and rate-of-return issues than
about safety and soundness. Stock markets already are being led higher
by their cyclical components as the ‘low beta’ or ‘safe’ stock market
sectors languish. Investors who were ‘once bit, twice shy’ with their
dollar assets are going to have to decide if the US has become a safe
place to invest again or they will have to look elsewhere. It they look
elsewhere, will that place be any safer than the US, if global saving
imbalances are allowed to grow again? These decisions carry with them
exchange rate implications. If the ‘Chinas’ of the world want to (and
are allowed to) preserve their competitiveness positions Vs the dollar
they need to continue to push funds into the US to support current
dollar levels. Otherwise, switching funds to other countries will drop
the dollar’s value and hike the exchange rate of the yuan undercutting
their competitiveness. There is no de-linking these issues. Decisions
have consequences and consequences breed new decisions. There is no
doubt that the lessons of this cycle have important implications for
the period ahead and for the evolution of asset values. The question is
if those implications make the US and other places a safer place for
foreign monies or if foreign monies will now begin to deploy elsewhere.
And if they deploy elsewhere will that be to a destination of greater
safety or just to make a ‘new’ mistake in the future?
The currency values should tell much of the story of the
shifts in these flows of funds in the times ahead.
| E-Zone and main G-10 country GDP Results | |||||||
|---|---|---|---|---|---|---|---|
| Quarter over quarter-Saar | Year/Year | ||||||
| GDP | Q1-09 | Q4-08 | Q3-08 | Q1-09 | Q4-08 | Q3-08 | Q2-08 |
| Spain | -7.0% | -3.8% | -1.2% | -2.9% | -0.7% | 0.9% | 1.8% |
| UK | -7.4% | -5.9% | -2.8% | -4.2% | -2.0% | 0.4% | 1.8% |
| US | -6.1% | -6.3% | -0.5% | -2.6% | -0.8% | 0.7% | 2.1% |

Tom Moeller
AuthorMore in Author Profile »Prior to joining Haver Analytics in 2000, Mr. Moeller worked as the Economist at Chancellor Capital Management from 1985 to 1999. There, he developed comprehensive economic forecasts and interpreted economic data for equity and fixed income portfolio managers. Also at Chancellor, Mr. Moeller worked as an equity analyst and was responsible for researching and rating companies in the economically sensitive automobile and housing industries for investment in Chancellor’s equity portfolio. Prior to joining Chancellor, Mr. Moeller was an Economist at Citibank from 1979 to 1984. He also analyzed pricing behavior in the metals industry for the Council on Wage and Price Stability in Washington, D.C. In 1999, Mr. Moeller received the award for most accurate forecast from the Forecasters' Club of New York. From 1990 to 1992 he was President of the New York Association for Business Economists. Mr. Moeller earned an M.B.A. in Finance from Fordham University, where he graduated in 1987. He holds a Bachelor of Arts in Economics from George Washington University.
More Economy in Brief


