 Global| Dec 26 2019
U.S. Initial Claims for Unemployment Insurance Fell by 13,000
Summary
Initial claims for unemployment insurance decreased 13,000 in the week ended December 21 to 222,000 (-0.4% y/y) from the prior week's 235,000, which was revised upward by 1,000. The December 21 actual also equaled the Action Economics [...]
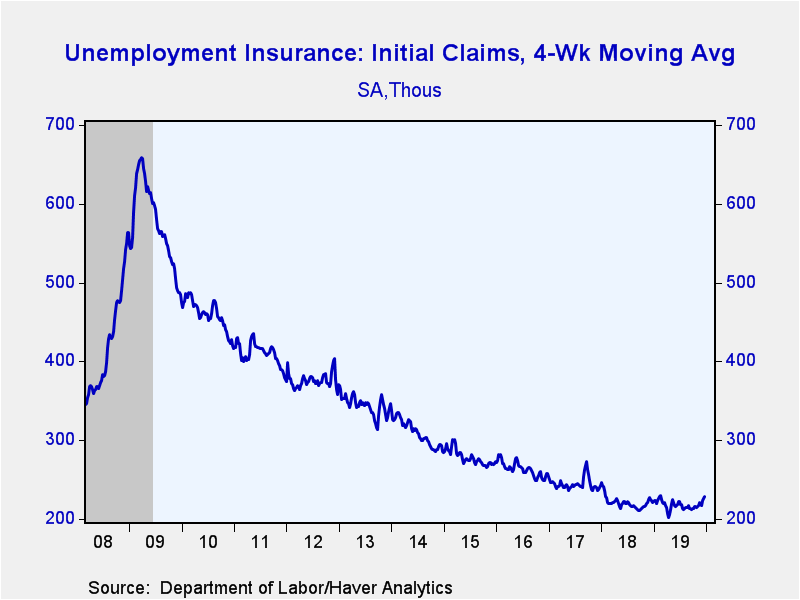
Initial claims for unemployment insurance decreased 13,000 in the week ended December 21 to 222,000 (-0.4% y/y) from the prior week's 235,000, which was revised upward by 1,000. The December 21 actual also equaled the Action Economics Forecast Survey at 222,000 claims. The four-week moving average of initial claims rose to 228,000 from 225,750.
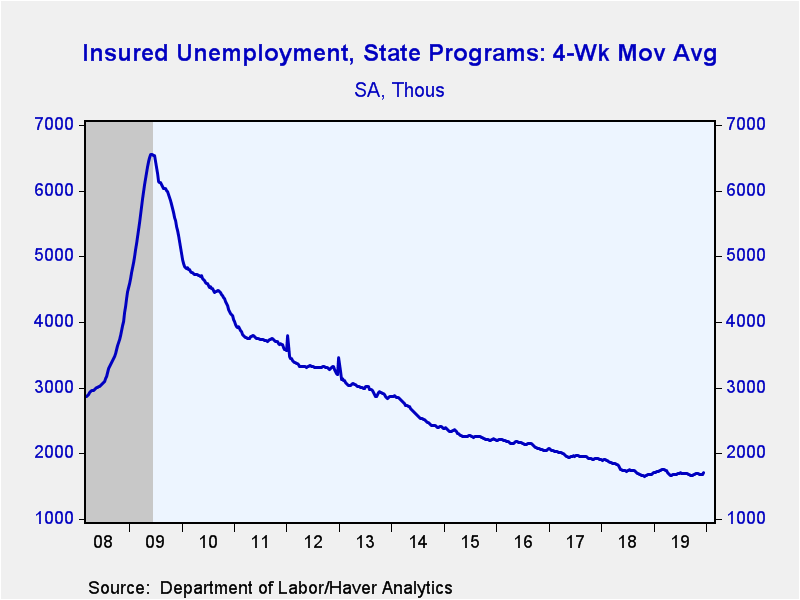
Continuing claims for unemployment insurance in the week ended December 14 eased 6,000 to 1.719 million (+1.2% y/y). The November 30 figure was revised up 3,000 to 1.725 million. The four-week moving average of claimants rose to 1.704 million from 1.684 million.
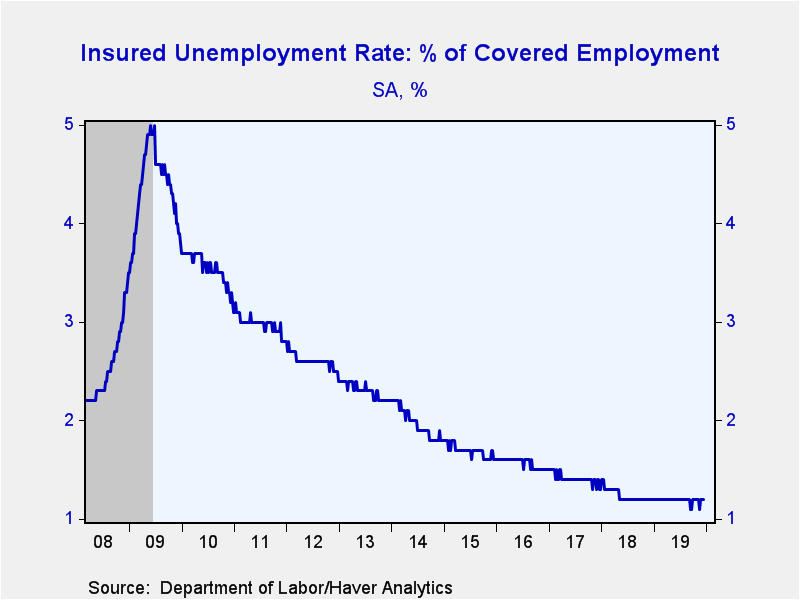
The insured rate of unemployment remained at 1.2% in the week of December 14. Except for two weeks in September and one week in mid-November, when the rate was at 1.1%, it has been 1.2% since May 2018.
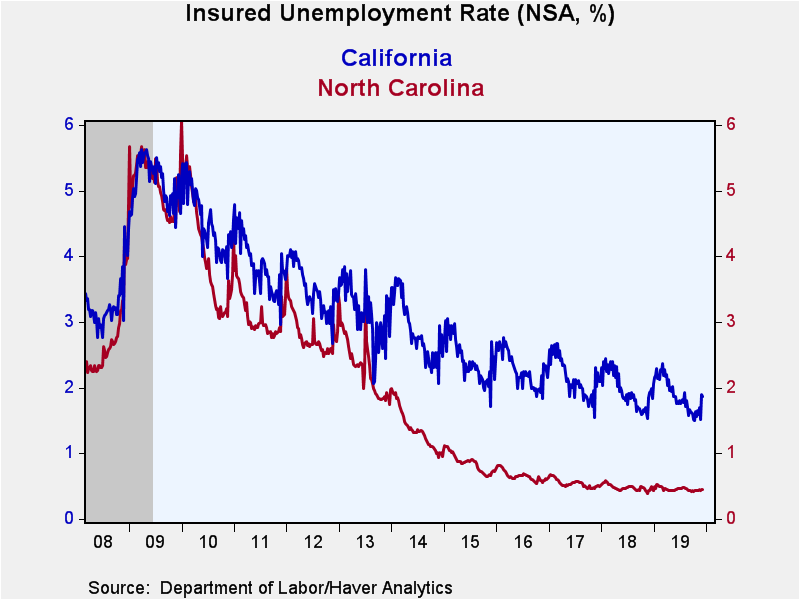
Insured unemployment rates vary widely by state. During the week ending December 7, the lowest rates were in Nebraska (0.32%), Florida (0.39%), North Carolina (0.45%), South Dakota (0.48%) and Indiana (0.51%). The highest rates were in Montana (1.91%), Pennsylvania (2.04%), New Jersey (2.14%), West Virginia (2.17%) and Alaska (2.82%). Among the other largest states by population not mentioned above, the rate was 1.00% in Texas, 1.46% in New York and 1.87% in California. These state data are not seasonally adjusted, thus Alaska has particularly large seasonal swings in insured rates of unemployment.
Data on weekly unemployment claims going back to 1967 are contained in Haver's WEEKLY database, and they are summarized monthly in USECON. Data for individual states are in REGIONW. The expectations figure is from the Action Economics Forecast Survey, carried in the AS1REPNA database.
| Unemployment Insurance (SA, 000s) | 12/21/19 | 12/14/19 | 12/07/19 | Y/Y % | 2018 | 2017 | 2016 |
|---|---|---|---|---|---|---|---|
| Initial Claims | 222 | 235 | 252 | -0.4 | 220 | 244 | 262 |
| Continuing Claims | -- | 1,719 | 1,725 | 1.2 | 1,756 | 1,961 | 2,135 |
| Insured Unemployment Rate (%) | -- | 1.2 | 1.2 |
1.2 |
1.2 | 1.4 | 1.6 |
Carol Stone, CBE
AuthorMore in Author Profile »Carol Stone, CBE came to Haver Analytics in 2003 following more than 35 years as a financial market economist at major Wall Street financial institutions, most especially Merrill Lynch and Nomura Securities. She had broad experience in analysis and forecasting of flow-of-funds accounts, the federal budget and Federal Reserve operations. At Nomura Securities, among other duties, she developed various indicator forecasting tools and edited a daily global publication produced in London and New York for readers in Tokyo. At Haver Analytics, Carol was a member of the Research Department, aiding database managers with research and documentation efforts, as well as posting commentary on select economic reports. In addition, she conducted Ways-of-the-World, a blog on economic issues for an Episcopal-Church-affiliated website, The Geranium Farm. During her career, Carol served as an officer of the Money Marketeers and the Downtown Economists Club. She had a PhD from NYU's Stern School of Business. She lived in Brooklyn, New York, and had a weekend home on Long Island.


