 Global| Sep 24 2009
U.S. Initial Claims For JoblessInsurance Near Cycle Low But Continuing Claims Hold Steady
by:Tom Moeller
|in:Economy in Brief
Summary
Initial claims for jobless insurance continue to suggest labor market improvement. The Labor Department indicated that last week claims fell 21,000 to 530,000. It was the fourth decline in the last five weeks and left claims near [...]
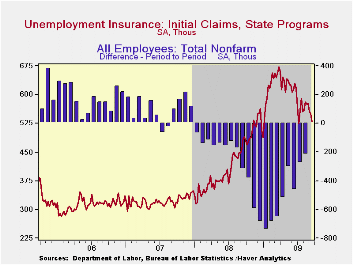 Initial
claims for jobless insurance continue to suggest labor market
improvement. The Labor Department indicated that last week claims fell
21,000 to 530,000. It was the fourth decline in the last five weeks and
left claims near their lowest level since early-January. The latest
level was down from the March peak of 674,000 and the weekly decline
exceeded expectations for a drop to 550,000 claims.
Initial
claims for jobless insurance continue to suggest labor market
improvement. The Labor Department indicated that last week claims fell
21,000 to 530,000. It was the fourth decline in the last five weeks and
left claims near their lowest level since early-January. The latest
level was down from the March peak of 674,000 and the weekly decline
exceeded expectations for a drop to 550,000 claims.
In contrast, an
earlier decline in continuing claims for unemployment insurance has
slowed. During the latest week continuing claims fell 123,000 after a
158,000 rise during the prior period, though they were down by 11% from
the late-June high. 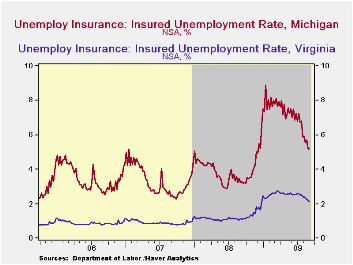 Continuing claims provide an indication of workers'
ability to find employment. The four-week average of continuing claims
fell modestly to 6,182,500. The series dates back to
1966. · Extended benefits for unemployment insurance
held steady at 438,053 as worker rehiring continued weak. The latest
level is off just slightly from the July high.
Continuing claims provide an indication of workers'
ability to find employment. The four-week average of continuing claims
fell modestly to 6,182,500. The series dates back to
1966. · Extended benefits for unemployment insurance
held steady at 438,053 as worker rehiring continued weak. The latest
level is off just slightly from the July high.
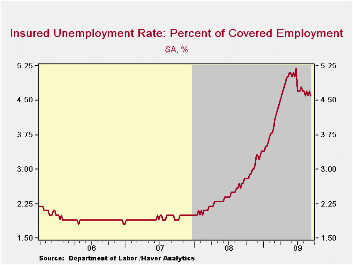
The insured rate of unemployment dipped slightly to 4.6% and was near the lowest level since mid-April. The rate reached a high of 5.2% during late-June. During the last ten years, there has been a 93% correlation between the level of the insured unemployment rate and the overall rate of unemployment published by the Bureau of Labor Statistics.
 The highest insured unemployment rates in the week ending September 5
were in Puerto Rico (6.7 percent), Oregon (5.6), Nevada (5.4),
Pennsylvania (5.4), Michigan (5.2), Wisconsin (4.9), California (4.8),
New Jersey (4.8), Connecticut (4.7), North Carolina (4.7), and South
Carolina (4.7). The lowest rates were in South Dakota (1.1) and North
Dakota (1.4), Virginia (2.2), Wyoming (2.6), Texas (2.7), Maine (2.8),
Colorado (3.0), Minnesota (3.3), Maryland (3.4), Mississippi (3.8),
Florida (4.0), New York (4.1), and Georgia (4.1).
The highest insured unemployment rates in the week ending September 5
were in Puerto Rico (6.7 percent), Oregon (5.6), Nevada (5.4),
Pennsylvania (5.4), Michigan (5.2), Wisconsin (4.9), California (4.8),
New Jersey (4.8), Connecticut (4.7), North Carolina (4.7), and South
Carolina (4.7). The lowest rates were in South Dakota (1.1) and North
Dakota (1.4), Virginia (2.2), Wyoming (2.6), Texas (2.7), Maine (2.8),
Colorado (3.0), Minnesota (3.3), Maryland (3.4), Mississippi (3.8),
Florida (4.0), New York (4.1), and Georgia (4.1).
The unemployment insurance claims data is available in Haver's WEEKLY database and the state data is in the REGIONW database.
Financial Crises Tend to Have Long Impact on the Economy from the International Monetary Fund can be found here.
| Unemployment Insurance (000s) | 09/19/09 | 09/12/09 | 09/05/09 | Y/Y | 2008 | 2007 | 2006 |
|---|---|---|---|---|---|---|---|
| Initial Claims | 530 | 551 | 557 | 9.3% | 420 | 321 | 313 |
| Continuing Claims | -- | 6,138 | 6,261 | 71.4% | 3,342 | 2,552 | 2,459 |
| Insured Unemployment Rate (%) | -- | 4.6 | 4.7 | 2.7 (09/2008) | 2.5 | 1.9 | 1.9 |
Germany's IFO Continues Steady Gain; Still Pessimists Deride Result
by Robert Brusca September 24, 2009
A slower pace of improvement in September -
The pace of improvement in the diffusion and headline index barometers
for Germany’s IFO are slowing their rate of gain this month. After
averaging increases of 3.3 points per month since they began to turn
positive in April, this month’s headline gain in the diffusion index
was 1.6. For the expectations index, similarly, the average gain has
been 5.4 but this month the rise was a more meager 1.4 diffusion points.
CONTEXT! While the Sept gain is smaller than what
has been on average in this nascent recovery it is also true that
September’s report comes on the heels of a very strong August reading
where the headline diffusion index improved by 6.1 points and
expectations rose by 9.1 points. In the spirit of recognizing
volatility, if we average the two months, we are ahead of what has been
the average. There are in fact past experiences in this cycle that have
seen a slowdown followed by a spurt. For example in June, the IFO
expectations diffusion index soared by 7.1 points only to rise by just
1.7 points in July but then to spurt again by 9.1 points in August. So,
why make so much of a one month partial stumble?
Separating the wheat from the chaff has always been hard -
What is hard in these early recovery periods to separate volatility
from trend. In this business cycle in both in the US and in Europe
there seems to be a lot of pessimists that are eager to grasp the first
sign of bad news and to extrapolate it. I would warn against that here.
Rolling up our sleeves…the recovery trends show us -
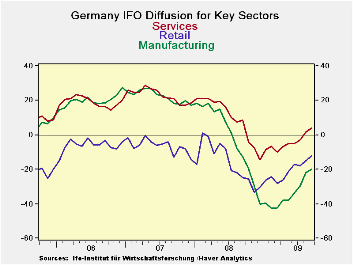
The diffusion values are somewhat more telling when looked at by
sector. Three of five sectors have had their largest in-recovery gain
in August. Even so two of those three still posted about as large gain
in September as they had in July before the August spurt. Manufacturing
is one exception to that and it still had a 2 diffusion point gain in
September after an August gain of 7.7 points. Services and wholesaling
displayed the strong resilience of spurting in August and still posting
a September value about as strong as they had before the spurt in July.
Retailing has been fickle in the recovery with its largest diffusion
gain in June followed by an outright drop in July which was then
followed by two solid-to-strong increases of more than two points in
each of August and Sept. Lastly, the construction sector is simply
erratic. In the seven months that the other indicators have been
increasing almost without fail, the construction index has dropped four
times. Among the other four sectors there is only one monthly set-back
(in retailing) for all of them.
Summing up - On balance given that the recovery
cycle is still young it is hard to look at this month’s IFO sector
recovery patterns and to become a pessimist even on the likely speed of
recovery. Recovery itself is still in train and we saw improvement in
four of five key sectors on their diffusion gauges. The pace of
recovery did slow when compared to the previous month but that month
was a spike for many sectors. When placed in context, the recovery
speed still seems to be quite good with only the one-month result to be
a harbinger of a slowdown - and we all know how dangerous it is to base
assessments on one single data observation. That the Zew index showed
the same sort of soft spot in Sept says only something about September,
not about the future. So I will remain upbeat in the wake of this
report despite the fact that the weight of opinion is on the other side
and despite the euro taking a cue to back-off after this report. The
euro back-off makes sense because the trade-weighted and inflation
adjusted euro is already so strong. Recovery will be hard to sustain if
the euro continues to advance has it has regardless of whether the
recovery has already started to slow or not.
| Summary of IFO Sector Diffusion readings: CLIMATE | ||||||||
|---|---|---|---|---|---|---|---|---|
| CLIMATE Sum | Current | Last Mo | Since Jan 1991* | |||||
| Sep-09 | Aug-09 | Average | Median | Max | Min | Range | % Range | |
| All Sectors | -18.1 | -19.7 | -9.5 | -9.9 | 17.5 | -36.1 | 53.6 | 33.6% |
| MFG | -19.9 | -21.9 | -2.2 | -0.8 | 27.6 | -42.7 | 70.3 | 32.4% |
| Construction | -25.7 | -24.0 | -29.4 | -30.4 | 0.0 | -50.1 | 50.1 | 48.7% |
| Wholesale | -12.2 | -14.5 | -14.8 | -16.3 | 23.9 | -39.0 | 62.9 | 42.6% |
| Retail | -12.4 | -14.9 | -16.1 | -15.1 | 16.2 | -40.4 | 56.6 | 49.5% |
| Services | 3.8 | 1.4 | 10.9 | 9.5 | 28.5 | -14.5 | 43.0 | 42.6% |
| * June 2001 for Services | ||||||||
by Tom Moeller September 24, 2009
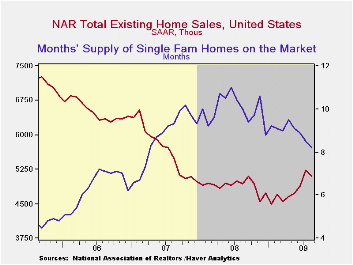
The National Association of Realtors reported that August sales of existing homes unexpectedly fell following four consecutive months of increase. The 2.7% m/m decline to 5.100M units (SAAR) nevertheless left sales still near the highest level since late-2007. The decline in August sales contrasted with Consensus expectations for a rise to 5.35M. Total sales include sales of condos and co-ops.
Sales of existing single-family homes alone similarly fell 2.8% to 4.480M last month but were up 10.6% from the January low. (These data have a longer history than the total sales series).
Recent sales have been helped by a tax credit for first-time
home buyers. The credit of up to $8,000 extends though the end of this
year. The full details of the home-buyer tax credit can be found here.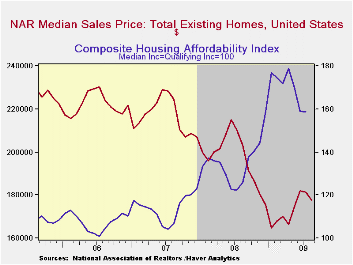
The median price of an existing home fell for the second straight month, to $177,700. Though prices were still lower than the year ago level, they have risen by 7.8% from the January low. The median price for a single-family home was $177,500 (-12.1% y/y). During August, the composite index of home affordability slipped during July and was down 11.4% from the April high.
In a reversal of the recent trend, potential sellers put fewer homes on the market. The number of unsold homes (condos & single-family) for sale fell 10.8% during August to near the lowest level since early-2007. Year-to-year inventories were down 16.4%. At the current sales rate there was an 8.5 months' supply on the market which was the lowest since mid-2007. The figure was down from 9.3 months during July. For single-family homes the inventory fell 9.1% m/m (-16.7% y/y). At the current sales rate there was an 8.2 month's supply of homes on the market, the lowest since 2007.
The data on existing home sales, prices and affordability can be found in Haver's USECON database. The regional price, affordability and inventory data is available in the REALTOR database.
Systemic Risk and the Financial Crisis from the Federal Reserve Bank of St. Louis can be found here.
| Existing Home Sales (Thous, SAAR) | August | July | Y/Y | 2008 | 2007 | 2006 |
|---|---|---|---|---|---|---|
| Total | 5,100 | 5,240 | 3.4% | 4,893 | 5,674 | 6,516 |
| Northeast | 910 | 930 | 5.8 | 845 | 1,010 | 1,093 |
| Midwest | 1,140 | 1,220 | 0.0 | 1,130 | 1,331 | 1,494 |
| South | 1,890 | 1,950 | 1.6 | 1,860 | 2,243 | 2,577 |
| West | 1,160 | 1,130 | 7.4 | 1,064 | 1,095 | 1,357 |
| Single-Family | 4,480 | 4,610 | 2.5 | 4,341 | 4,960 | 5,712 |
| Median Price, Total, $ | 177,700 | 181,500 | -12.5 | 197,250 | 216,633 | 222,042 |
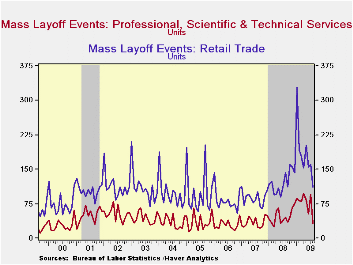
by Tom Moeller September 24, 2009
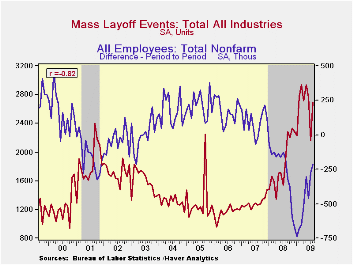 The U.S.
Labor Department reports figures covering mass layoffs which involve at
least 50 initial claimants from a single establishment filing during a
consecutive 5-week period. They include short-term layoffs of 30 days
or fewer. During August, these layoffs recouped most of their July
decline and were up by nearly one-half from the year earlier level. The
series is most relevant because during the last ten years there has
been a (negative) 82% correlation between layoffs and the m/m change in
payroll employment.
The U.S.
Labor Department reports figures covering mass layoffs which involve at
least 50 initial claimants from a single establishment filing during a
consecutive 5-week period. They include short-term layoffs of 30 days
or fewer. During August, these layoffs recouped most of their July
decline and were up by nearly one-half from the year earlier level. The
series is most relevant because during the last ten years there has
been a (negative) 82% correlation between layoffs and the m/m change in
payroll employment.
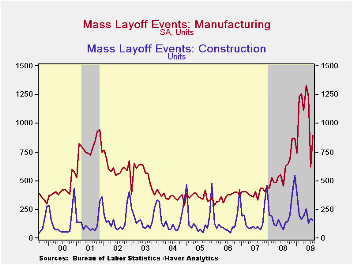 Layoffs in
private industries were quite
significant last month and totaled 2,428, up 39.9% from last August.
The jump from July very much reflected 900 layoff events (SA) in the
factory sector. Though they were up significantly from last year they
have fallen sharply from their 2009 peak. Layoffs in the machinery,
transportation equipment, computer & electronics, electrical
equipment, furniture industries were notable.
Layoffs in
private industries were quite
significant last month and totaled 2,428, up 39.9% from last August.
The jump from July very much reflected 900 layoff events (SA) in the
factory sector. Though they were up significantly from last year they
have fallen sharply from their 2009 peak. Layoffs in the machinery,
transportation equipment, computer & electronics, electrical
equipment, furniture industries were notable.
Mass layoffs in the construction industry followed next and there were 160 of them. While down slightly from July, they remained up by 12.7% from last August after increases of roughly one-quarter during the prior two years. In the service sector mass layoffs have become fewer in number, as reflected in the monthly reports on nonfarm payrolls. Layoffs have fallen y/y in the retail trade, information, real estate, professional & technical and the arts & entertainment industries.
 Meanwhile,
layoffs by in the
government sector have risen by one-third
y/y led by a three-quarters increase in the Federal sector and an
increase of nearly one-half by state governments. Local governments
have increased layoffs by a lesser 18% y/y.
Meanwhile,
layoffs by in the
government sector have risen by one-third
y/y led by a three-quarters increase in the Federal sector and an
increase of nearly one-half by state governments. Local governments
have increased layoffs by a lesser 18% y/y.
The Mass layoff data are available in Haver's SURVEYS database.
Federal Reserve Transparency is today's House testimony Scott G. Alvarez, General Counsel, and it is available here.
| Mass Layoff Events | August | July | August '09 | 2008 | 2007 | 2006 |
|---|---|---|---|---|---|---|
| Total, All Industries (SA) | 2,690 | 2,157 | 1,887 | 22,016 | 15,495 | 13,890 |
| Private Nonfarm | 2,428 | 1,928 | 1,735 | 20,258 | 14,115 | 12,478 |
| Manufacturing | 900 | 621 | 626 | 7,174 | 4,789 | 4,283 |
| Private Nonfarm (NSA) | 1,334 | 2,659 | 1,343 | 19,432 | 14,046 | 12,587 |
| Construction | 160 | 170 | 142 | 2,393 | 1,952 | 1,546 |
| Retail Trade | 111 | 161 | 142 | 1,457 | 1,048 | 991 |
| Information | 46 | 90 | 48 | 545 | 383 | 350 |
| Finance & Insurance | 47 | 84 | 45 | 552 | 510 | 310 |
| Real Estate, Rental & Leasing | 7 | 12 | 13 | 118 | 71 | -- |
| Professional & Technical Services | 32 | 95 | 45 | 564 | 420 | 352 |
| Health Care & Social Assistance | 31 | 101 | 35 | 580 | 450 | 415 |
| Arts, Entertainment & Recreation | 19 | 38 | 18 | 311 | 240 | 245 |
| Government | 72 | 302 | 54 | 1,007 | 779 | 760 |

Tom Moeller
AuthorMore in Author Profile »Prior to joining Haver Analytics in 2000, Mr. Moeller worked as the Economist at Chancellor Capital Management from 1985 to 1999. There, he developed comprehensive economic forecasts and interpreted economic data for equity and fixed income portfolio managers. Also at Chancellor, Mr. Moeller worked as an equity analyst and was responsible for researching and rating companies in the economically sensitive automobile and housing industries for investment in Chancellor’s equity portfolio. Prior to joining Chancellor, Mr. Moeller was an Economist at Citibank from 1979 to 1984. He also analyzed pricing behavior in the metals industry for the Council on Wage and Price Stability in Washington, D.C. In 1999, Mr. Moeller received the award for most accurate forecast from the Forecasters' Club of New York. From 1990 to 1992 he was President of the New York Association for Business Economists. Mr. Moeller earned an M.B.A. in Finance from Fordham University, where he graduated in 1987. He holds a Bachelor of Arts in Economics from George Washington University.
More Economy in Brief


