 Global| Feb 05 2009
U.S. Initial Claims For Jobless Insurance Highest Since 1982, Continuing Claims Reach Another Record
by:Tom Moeller
|in:Economy in Brief
Summary
U.S. labor market conditions became more bleak last week as initial claims for unemployment insurance jumped 35,000 to 626,000. Moreover, the prior week's modest increase was revised up slightly and the latest level by far surpassed [...]
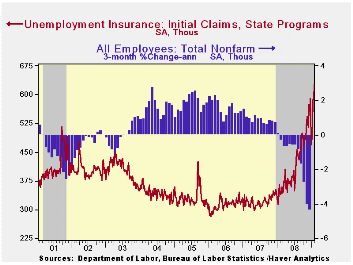
U.S. labor market conditions became more bleak last week as initial claims for unemployment insurance jumped 35,000 to 626,000. Moreover, the prior week's modest increase was revised up slightly and the latest level by far surpassed Consensus expectations for 580,000 initial claims. Initial claims continue to be the highest since late during the sharp recession of 1981-82. During that recession, real GDP fell by 2.9% peak-to-trough.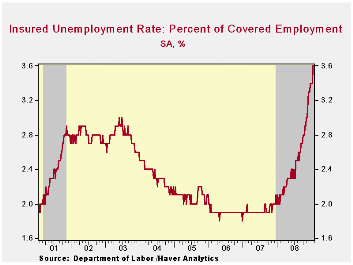
The Labor Department indicated that the largest increases in initial claims for the week ending January 24 were in Wisconsin (+1,355), Rhode Island (+689), Virginia (+682), Oklahoma (+406), and Puerto Rico (+314), while the largest decreases were in Florida (-14,703), California (-12,074), Michigan (-11,639), Georgia (-9,949), and Ohio
(-9,926).
Labor market stress was further indicated by a rise in continuing claims for unemployment insurance to another record level. The series dates back to 1966. During the week of January 24 they rose 20,000 on top of 151,000 and 102,000 increases during the prior two weeks. The four-week average of continuing claims rose 44,000 to 4,672,000. Continuing claims provide some indication of workers' ability to find employment and they lag the initial claims figures by one week.
Though the latest level of continuing claims was a record, the labor force has grown as well. Therefore, the insured rate of unemployment was not at a new high. It remained stable at 3.6% which was, however, the highest since 1983. The highest insured unemployment rates in the week ending January 17 were in Michigan (8.9 percent), Idaho (6.6), Oregon (6.6), Pennsylvania (6.2), South Carolina (6.0), Wisconsin (6.0), Alaska (5.6), Nevada (5.5), Indiana (5.4), and Montana (5.3).
| Unemployment Insurance (000s) | 01/31/09 | 01/24/09 | 01/17/09 | Y/Y | 2008 | 2007 | 2006 |
|---|---|---|---|---|---|---|---|
| Initial Claims | 626 | 591 | 585 | 78.3% | 420 | 321 | 313 |
| Continuing Claims | -- | 4,788 | 4,768 | 72.7% | 3,342 | 2,552 | 2,459 |
by Tom Moeller February 5, 2009
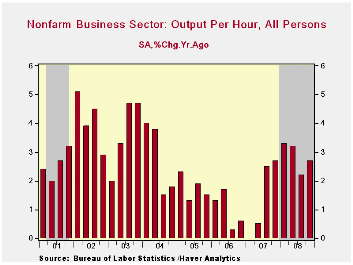
During last year's fourth quarter, labor productivity in the nonfarm business sector rose 3.2% (AR), up sharply from a 1.5% increase during 3Q. The rise pulled growth for the whole year up to 2.8% which doubled the gain during all of 2007. The rise far outpaced Consensus expectations for a 1.2% increase.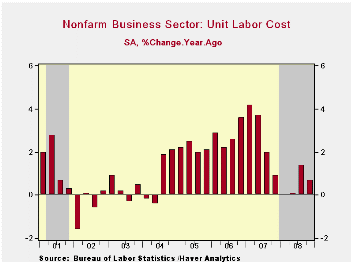
As workers became more productive last quarter, that raised the growth in compensation to 5.0%. Year-to-year, however, the rise failed to translate into faster growth in worker pay. Growth in compensation per hour in fact decelerated last year to 3.4% which was the slowest since 1997.
The drop in compensation growth was the result of the recession. It lowered output by 5.5% during 4Q and growth for the full year to 1.0% from 2.0% in 2007 and from 3.2% in 2006. Hours worked fell by more, thus lifting productivity. They fell at an 8.4% rate last quarter and 1.8% for the full year.
The acceleration in productivity growth dropped the quarterly increase in unit labor costs to 1.8%. For the full year, the 0.5% gain in unit labor costs was the weakest in five years.
In the factory sector, however, the story was different. Productivity declined at a 3.0% rate which was near the rate of decline during the prior two quarters. For the year as a whole factory sector productivity did rise 1.3%. However, that only about matched the 2006 increase which was down sharply from a 4.9% rise in 2005 and gains of 6% to 7% in 2002 and 2003. Unit labor cost growth in the factory sector thus surged last quarter at a 13.3% rate and it rose at a quickened 2.5% rate for the year.
| Nonfarm Business Sector (SAAR, %) | 4Q '08 | 3Q '08 | Y/Y | 2008 | 2007 | 2006 |
|---|---|---|---|---|---|---|
| Output per Hour | 3.2 | 1.5 | 2.7 | 2.8 | 1.4 | 1.0 |
| Compensation per Hour | 5.0 | 4.2 | 3.5 | 3.4 | 4.1 | 3.8 |
| Unit Labor Costs | 1.8 | 2.6 | 0.7 | 0.5 | 2.7 | 2.8 |
by Tom Moeller February 5, 2009
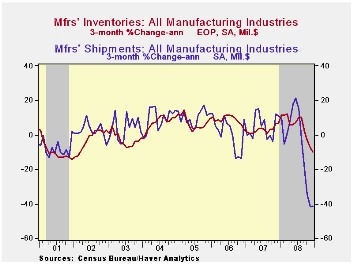
The correction of factory inventory levels has picked up steam. In December, the 1.4% decline followed a 0.5% November drop that was roughly double the initial estimate of -0.3%. On a three-month basis, the rate of decline accelerated to 9.7%. To be sure, these figures have been influenced by the decline in oil prices. However, a broad-based inventory correction in the factory sector still is underway. Less oil, factory inventories fell 0.5% during December. That lowered the three-month change to a negative 0.6% (AR) after 8% rates of growth earlier in 2008.
The commercial aircraft industry continued to dominate the nonoil industry figures with a positive 45.6% year-to-year growth rate. To the downside, automobile inventories have been reduced by 8.7% versus last year. Electrical equipment & appliance inventories grew at a 0.5% rate in December versus double-digit growth early in 2007 and growth in machinery inventories has been nearly halved to 6%. Steep production cutbacks pulled furniture inventories down 5.2%. The computer industry bucked the trend and inventories rose at a 6.8% rate last year versus slight decumulation in 2007.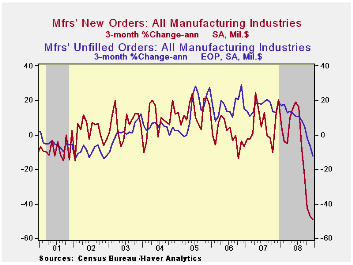
Total factory orders dropped sharply again in December. The 3.9% decline was the fourth in a row between -3% and -7%, but that reflected the drop in oil prices (orders here equal shipments). Textile mill orders fell 4.2% (-18.2% y/y) and apparel orders fell 3.1% y/y. Orders for durable goods orders fell 3.0% reflecting the 43.8% drop in commercial aircraft orders. Less commercial aircraft, orders for durable goods fell 1.9% or 16.0% y/y.
Factory shipments dropped 2.9% due to lower oil prices. Less oil, shipments fell a lesser 1.3% but year-to-year they were down sharply by 7.4%. Automobile shipments were off by more than one quarter year-to-year and shipments of electrical equipment were off 9.7%. Electronic computer shipments fell 29.1% y/y with lower prices while shipments of furniture & related products fell 12.5%.
Total unfilled orders fell 1.4%, but less the transportation sector where aircraft backlogs still are strong, unfilled orders fell 2.2%.
Why Do Firms Use Temporary Workers? from the Federal Reserve Bank of Chicago is available here.
| Factory Survey (NAICS, %) | December | November | Y/Y | 2008 | 2007 | 2006 |
|---|---|---|---|---|---|---|
| Inventories | -1.4 | -0.5 | 2.6 | 2.6 | 3.7 | 8.2 |
| Excluding Transportation | -2.3 | -1.1 | -0.0 | -0.0 | 2.7 | 7.9 |
| New Orders | -3.9 | -6.5 | -18.7 | 0.2 | 1.9 | 6.2 |
| Excluding Transportation | -4.4 | -6.0 | -15.2 | 3.2 | 1.2 | 7.4 |
| Shipments | -2.9 | -6.5 | -12.8 | 1.8 | 1.2 | 5.9 |
| Excluding Transportation | -3.5 | -6.8 | -12.2 | 3.7 | 1.5 | 6.7 |
| Unfilled Orders | -1.4 | -0.9 | 3.7 | 3.7 | 17.1 | 15.3 |
| Excluding Transportation | -2.2 | -1.4 | -0.6 | -0.6 | 8.2 | 16.0 |

Tom Moeller
AuthorMore in Author Profile »Prior to joining Haver Analytics in 2000, Mr. Moeller worked as the Economist at Chancellor Capital Management from 1985 to 1999. There, he developed comprehensive economic forecasts and interpreted economic data for equity and fixed income portfolio managers. Also at Chancellor, Mr. Moeller worked as an equity analyst and was responsible for researching and rating companies in the economically sensitive automobile and housing industries for investment in Chancellor’s equity portfolio. Prior to joining Chancellor, Mr. Moeller was an Economist at Citibank from 1979 to 1984. He also analyzed pricing behavior in the metals industry for the Council on Wage and Price Stability in Washington, D.C. In 1999, Mr. Moeller received the award for most accurate forecast from the Forecasters' Club of New York. From 1990 to 1992 he was President of the New York Association for Business Economists. Mr. Moeller earned an M.B.A. in Finance from Fordham University, where he graduated in 1987. He holds a Bachelor of Arts in Economics from George Washington University.
More Economy in Brief


