 Global| Sep 15 2008
U.S. Industrial Production Plummeted; Auto Output Plunged
by:Tom Moeller
|in:Economy in Brief
Summary
August industrial production plummeted 1.2% following a little-revised 0.1% uptick during July. Consensus expectations had been for no change in output last month. The latest monthly decline was the largest since September 2005. The [...]
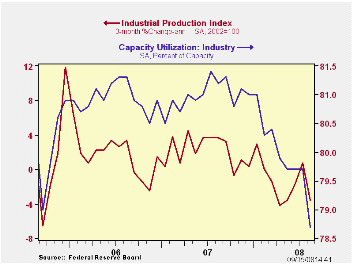
August industrial production plummeted 1.2% following a little-revised 0.1% uptick during July. Consensus expectations had been for no change in output last month. The latest monthly decline was the largest since September 2005. The y/y change of -1.5% was the worst since 2002, just after the last recession.
Factory output dropped 1.0%, led lower by an 11.9% (-20.7% y/y) decline in the output of motor vehicles & parts. Less autos, output still fell last month but by a moderate 0.3% (-0.6% y/y). That year-to-year change in output less autos of 0.6% indeed was the weakest reading since 2002. It compares to growth of negative 6.0% by the end of the last recession.
Output in the high-tech sector ticked up 0.1% (19.4% y/y)
after a 1.3% surge during July. Less high-tech, factory output fell
1.0%, dragged lower by that drop in auto production. Less both autos
and high-tech, output fell 0.4% (-1.8% y/y) last month.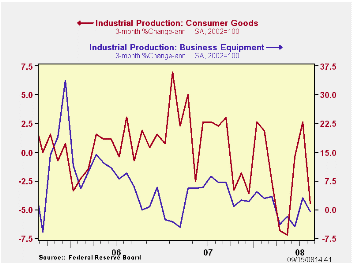
Indeed the industry detail continued mixed, but mostly weak. August output of furniture fell 2.9% (-13.1% y/y). Apparel output dropped 0.9% (-3.2% y/y) last month while paper production was off 0.5% (-3.1% y/y). Production of chemicals fell 0.3% (-1.1% y/y) and electrical equipment fell 1.9% (-0.8% y/y). To the upside was output of primary metals which rose by 0.5% ( 0.2% y/y).
In the high-tech area, production of computers & office equipment rose 0.8% (17.3% y/y) while output of communications equipment was unchanged last month but up 15.9% y/y. Semiconductor output ticked down 0.3%. It was up 2.6% year-over-year.
Capacity utilization fell to 78.7% which was its lowest level since 2004. Utilization in the factory sector dropped to 76.6% versus which also was it's lowest since late-2004.
The Federal Reserve Board on Sunday announced several initiatives to provide additional support to financial markets and the full report can be found here.
| INDUSTRIAL PRODUCTION (SA, %) | August | July | Y/Y | 2007 | 2006 | 2005 |
|---|---|---|---|---|---|---|
| Total Output | -1.2 | 0.1 | -1.5 | 1.7 | 2.2 | 3.3 |
| Manufacturing | -1.0 | 0.1 | -1.9 | 1.7 | 2.4 | 4.0 |
| Consumer Goods | -2.0 | 0.2 | -3.0 | 1.7 | 0.3 | 2.8 |
| Business Equipment | -0.6 | 0.2 | 0.7 | 3.3 | 10.4 | 7.3 |
| Construction Supplies | -1.1 | 0.5 | -5.8 | -2.5 | 2.2 | 4.5 |
| Utilities | -3.2 | -1.6 | -4.2 | 3.3 | -0.6 | 2.1 |
| Capacity Utilization | 78.7 | 79.7 | 81.2 | 81.0 | 80.9 | 80.2 |
by Tom Moeller September 15, 2008
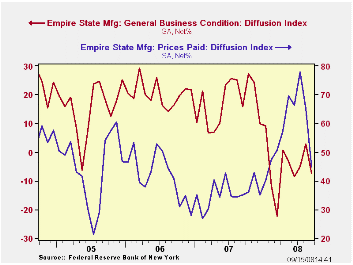
The Federal Reserve Bank of New York reported that its September index of manufacturing activity in the Empire State was again negative. At -7.41 the reading fell from a positive 2.77 in August. Following modest improvement from more negative readings early this year, the figure has moved sideways. A reading of +1.0 for had been the Consensus expectation for September.
At 44.83, the index of pricing pressure fell more than twenty points from August to its lowest level since January. Since inception in 2001 there has been an 81% correlation between the index of prices paid and the three-month change in the core intermediate materials PPI.
The figure is a diffusion index. Since the series' inception in 2001 there has been a 55% correlation between the index level and the three-month change in U.S. factory sector industrial production.
The indexes for new orders, shipments and unfilled orders rose
but delivery times, inventories and the average workweek fell.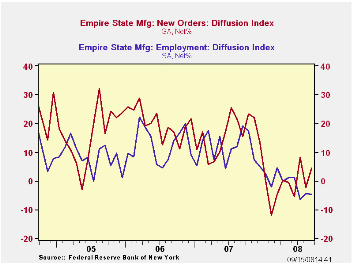
The employment index also fell during September and was negative for the third consecutive month. In the (perhaps too) short seven year history of the NY employment index, there has been an 86% correlation between it and the three-month growth in overall factory sector employment.
Like the Philadelphia Fed Index of General Business Conditions, the Empire State Business Conditions Index reflects answers to an independent survey question; it is not a weighted combination of the components.
The Empire State index of expected business conditions in six months jumped to its highest level since October of last year. The subseries for shipments and employment jumped and the pricing series fell to its lowest level in twelve months.
The Empire State Manufacturing Survey is a monthly survey of manufacturers in New York State conducted by the Federal Reserve Bank of New York. Participants from across the state in a variety of industries respond to a questionnaire and report the change in a variety of indicators from the previous month. Respondents also state the likely direction of these same indicators six months ahead.
For more on the Empire State Manufacturing Survey, including methodologies and the latest report, click here.
Determinants of automobile loan default and prepayment from the Federal Reserve Bank of Chicago can be found here.
| Empire State Manufacturing Survey | September | August | September '07 | 2007 | 2006 | 2005 |
|---|---|---|---|---|---|---|
| General Business Conditions (diffusion index, %) | -7.41 | 2.77 | 15.88 | 17.23 | 20.24 | 15.53 |
| Prices Paid | 44.83 | 65.17 | 35.11 | 35.64 | 41.88 | 44.74 |
by Louise Curley September 15, 2008
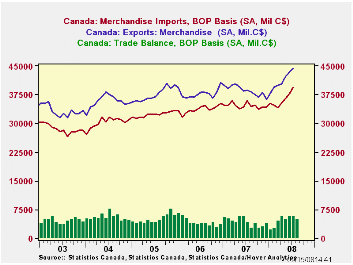
Canada's surplus on trade in goods was C$4.8 billion in July,
C$0.8 billion lower than in June but C$2.1 billion higher than July
2007. During the month of July, exports increased C$0.9 billion to
$44.3 billion but imports increased by C$1.7 billion to C$39.4 billion.
The first chart shows total exports, imports and the balance of trade
in goods.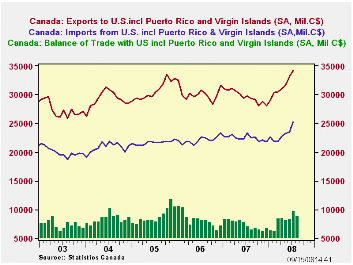
It appears that the decline in the total surplus is largely due to the decline in the surplus on trade with the United States. The balance of trade with the United States, Canada's biggest trading partner, was C$8.9 billion, down C$0.9 billion from C$9.7 billion in June, roughly of the same magnitude as the drop in the surplus in total trade. Exports to the US, which account for about three quarters of total exports increased by C$1.0 billion to reach C$34.2 billion but imports, which account for about two thirds of all imports increased by C$1.9 billion to reach C$25.3 billion. Exports to, and imports from, the United States are shown in the second chart together with the balance of trade with the U.S.
| CANADA TRADE IN GOODS (Billions C$) | Jul 08 | Jun 08 | Jul 07 | M/M Dif | Y/Y Dif | 2007 | 2006 | 2005 |
|---|---|---|---|---|---|---|---|---|
| Total Trade in Goods | ||||||||
| Exports | 44.3 | 43.3 | 38.7 | 0.9 | 5.5 | 463.1 | 453.7 | 450.2 |
| Imports | 39.4 | 37.7 | 35.9 | 1.7 | 3.5 | 415.0 | 404.3 | 387.8 |
| Balance | 4.9 | 5.6 | 2.8 | -0.8 | 2.1 | 48.0 | 49.5 | 62.3 |
| Trade with United States, Puerto Rico and Virgin Islands | ||||||||
| Exports | 34.2 | 33.1 | 29.7 | 1.0 | 4.4 | 356.1 | 361.4 | 368.4 |
| Imports | 25.3 | 23.4 | 23.3 | 1.9 | 2.0 | 269.8 | 265.0 | 259.3 |
| Balance | 8.9 | -.7 | 6.4 | -0.9 | 2.4 | 86.3 | 95.4 | 109.1 |
by Robert Brusca September 15, 2008
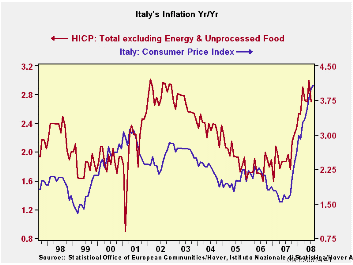
Italy’s inflation trends have yet to show decisive signs of turning lower. Italy’s total CPI is still pressing higher. The HICP Core rate shows a more hopeful sign of inflation topping but it shows no clear sign either of moving lower.
The three-month and six-month growth rates are flat at 3.8% and slightly below the Yr/Yr rate of 4.2%. The CPI that offers more inflation detail shows inflation slightly higher over 3 months and six months at 4.2% compared to year/year inflation at 4.1%. But the signals from the HICP and Italian domestic CPI rate are much the same. Across the various Italian CPI commodity categories, inflation is showing neither a tendency to accelerate or decelerate with inflation at a diffusion reading of 50 over three months or six months.
While energy prices are turning lower, there is optimism that inflation will turn lower.
| Italy HICP and CPI details | |||||||
|---|---|---|---|---|---|---|---|
| Mo/Mo % | Saar % | Yr/Yr | |||||
| Aug-08 | Jul-08 | Jun-08 | 3-Mo | 6-Mo | 12-Mo | Yr Ago | |
| HICP Total | 0.4% | -0.1% | 0.6% | 3.8% | 3.8% | 4.2% | 1.7% |
| Core | #N/A | -0.2% | 0.4% | #N/A | #N/A | #N/A | 2.0% |
| CPI | |||||||
| All | 0.1% | 0.4% | 0.5% | 4.2% | 4.2% | 4.1% | 1.6% |
| CPI ex Tobacco | 0.1% | 0.4% | 0.5% | 3.9% | 4.2% | 4.0% | 1.6% |
| Food | 0.4% | 0.4% | 0.4% | 5.2% | 5.5% | 6.3% | 2.4% |
| Alcohol | 0.4% | 1.2% | 0.5% | 8.4% | 4.7% | 5.1% | 2.3% |
| Clothing & Shoes | 0.1% | 0.1% | 0.1% | 1.2% | 1.6% | 1.7% | 1.3% |
| Rent & Utilities | -0.1% | 1.1% | 0.6% | 6.8% | 8.7% | 8.2% | 1.1% |
| Housing &Furniture | 0.1% | 0.2% | 0.3% | 2.2% | 2.2% | 2.8% | 2.7% |
| Health Care | 0.0% | 0.2% | 0.2% | 1.7% | 0.5% | 0.0% | -0.1% |
| Transport | 0.3% | 0.3% | 1.4% | 8.2% | 7.6% | 7.5% | 1.4% |
| Communication | -0.9% | -1.1% | 0.4% | -6.2% | -3.7% | -3.9% | -8.4% |
| Recreation & Culture | 0.0% | 0.2% | 0.2% | 2.0% | 1.1% | 1.2% | 0.9% |
| Education | 0.3% | 0.2% | 0.3% | 3.2% | 2.9% | 2.5% | 2.1% |
| Restaurant & Hotel | 0.2% | 0.3% | 0.4% | 3.8% | 3.3% | 2.4% | 3.2% |
| Other | 0.2% | 0.1% | 0.2% | 2.2% | 2.2% | 2.9% | 2.3% |
| Diffusion | 50.0% | 50.0% | 91.7% | ||||
| Type: Diffusion: Compared to 6-mo 12-mo Yr-Ago. | |||||||

Tom Moeller
AuthorMore in Author Profile »Prior to joining Haver Analytics in 2000, Mr. Moeller worked as the Economist at Chancellor Capital Management from 1985 to 1999. There, he developed comprehensive economic forecasts and interpreted economic data for equity and fixed income portfolio managers. Also at Chancellor, Mr. Moeller worked as an equity analyst and was responsible for researching and rating companies in the economically sensitive automobile and housing industries for investment in Chancellor’s equity portfolio. Prior to joining Chancellor, Mr. Moeller was an Economist at Citibank from 1979 to 1984. He also analyzed pricing behavior in the metals industry for the Council on Wage and Price Stability in Washington, D.C. In 1999, Mr. Moeller received the award for most accurate forecast from the Forecasters' Club of New York. From 1990 to 1992 he was President of the New York Association for Business Economists. Mr. Moeller earned an M.B.A. in Finance from Fordham University, where he graduated in 1987. He holds a Bachelor of Arts in Economics from George Washington University.
More Economy in Brief


