 Global| Apr 29 2005
U.S. Income & Spending Above Expectations
by:Tom Moeller
|in:Economy in Brief
Summary
Personal income in March topped Consensus expectations and rose 0.5% following an upwardly revised 0.4% increase in February. Disposable personal income also rose 0.5% (5.8% y/y) although when adjusted for price inflation take home [...]
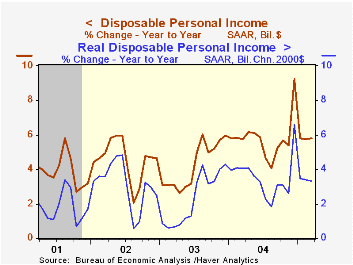
Personal income in March topped Consensus expectations and rose 0.5% following an upwardly revised 0.4% increase in February. Disposable personal income also rose 0.5% (5.8% y/y) although when adjusted for price inflation take home pay was unchanged m/m (3.3% y/y).
Wage & salary income rose 0.3% (5.8% y/y) following an upwardly revised like gain in February. Wages in service producing industries rose 0.4% (6.4% y/y) however factory sector wages fell 0.2% (5.8% y/y), the first decline in four months.
Personal consumption increased 0.6% and beat expectations for a 0.4% gain while February's increase was revised up. Durable goods spending jumped 2.2% (5.2% y/y) as spending on motor vehicles advanced 6.2% (7.5% y/y).
Nondurables spending fell slightly even though spending on gasoline & oil rose 6.4% (16.7% y/y), all a function of a 7.6% (20.2% y/y) rise prices. Spending on clothing fell 2.3% (+1.9% y/y). Services spending rose 0.6% (6.1% y/y) as the cost of household operation, including utilities, rose 1.7% (10.3% y/y).
The personal savings rate fell to 0.4%. The low number compares to the net worth of the household sector (from the flow of funds accounts) which has been rising. Total net worth was 5.5 times disposable income in 4Q04, up 10% versus the lows of two years earlier. The gain was powered by a 23.5% rise in the owners equity in real estate over those two years.
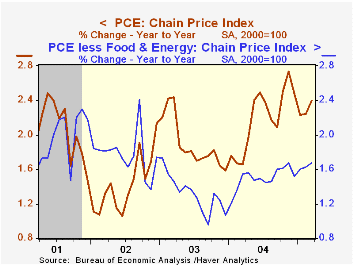
The PCE chain price index rose 0.5% and less food & energy, the 0.3% m/m increase pulled the y/y gain back to its highest level since early 2003.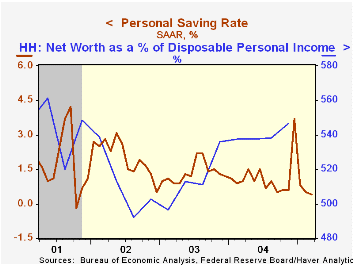
| Disposition of Personal Income | Mar | Feb | Y/Y | 2004 | 2003 | 2002 |
|---|---|---|---|---|---|---|
| Personal Income | 0.5% | 0.4% | 6.0% | 5.6% | 3.2% | 1.8% |
| Personal Consumption | 0.6% | 0.7% | 6.1% | 6.0% | 5.2% | 4.6% |
| Savings Rate | 0.4% | 0.5% | 1.0% | 1.2% | 1.4% | 2.0% |
| PCE Chain Price Index | 0.5% | 0.3% | 2.4% | 2.2% | 1.9% | 1.4% |
| Less food & energy | 0.3% | 0.2% | 1.7% | 1.5% | 1.3% | 1.8% |
by Tom Moeller April 29, 2005
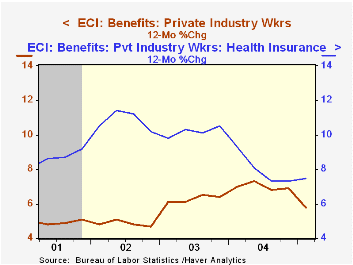
The employment cost index for private industry workers rose 0.6% last quarter and the rise was quite a bit more moderate than Consensus expectations for a 1.0% increase. Earlier figures were slightly revised.
Moderation came as benefit costs rose the least in three years. The 1.1% gain reflected a 0.4% (+6.3% y/y) rise in the manufacturing sector which compared to quarterly gains between 2 and 4% during the prior three years. The y/y rise in the cost of health benefits rose to 7.5% versus 7.3% growth in 2004 and a 10.5% rise during 2003.
Wage and salary growth picked up to 0.6% from 0.4% in 4Q04 but y/y growth is down by one-third from the peak in early 2002. Wages account for roughly 70% of the compensation index.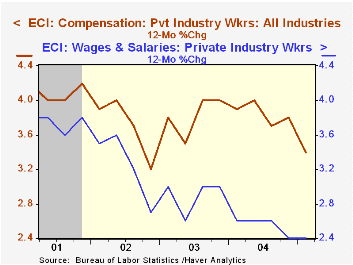
| ECI- Private Industry Workers | 1Q '05 | 4Q '04 | Y/Y | 2004 | 2003 | 2002 |
|---|---|---|---|---|---|---|
| Compensation | 0.6% | 0.8% | 3.4% | 3.8% | 4.0% | 3.2% |
| Wages & Salaries | 0.6% | 0.4% | 2.4% | 2.4% | 3.0% | 2.7% |
| Benefit Costs | 1.1% | 1.6% | 5.8% | 6.9% | 6.4% | 4.7% |
by Tom Moeller April 29, 2005
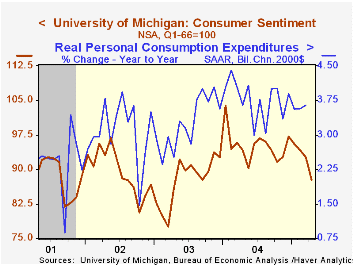
The University of Michigan's reading of consumer sentiment for all of April fell 5.3% from March to 87.7. The decline contrasted to Consensus expectations for a slightly firmer reading of 89.0.
Sentiment has fallen in each of the last four months and is off 15.5% from the January '04 peak. During the last ten years there has been a 75% (inverse) correlation between the level of consumer sentiment and the unemployment rate.
Consumer expectations added to the decline earlier in the month and dropped 7.0%, down for the fourth straight month. The expected change in real family income fell 12.2% to the lowest level since 1991. More unemployment was expected by the highest percentage since late 2003 and price inflation was expected to quicken.
The reading of current economic conditions fell 3.3%, a slight improvement from the mid-month reading.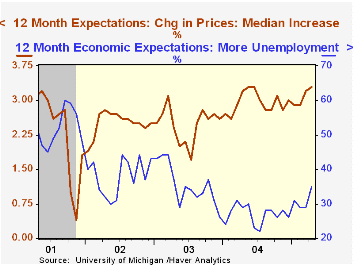
The University of Michigan survey is not seasonally adjusted.The mid-month survey is based on telephone interviews with 250 households nationwide on personal finances and business and buying conditions. The survey is expanded to a total of 500 interviews at month end.
| University of Michigan | April | Mar | Y/Y | 2004 | 2003 | 2002 |
|---|---|---|---|---|---|---|
| Consumer Sentiment | 87.7 | 92.6 | -6.9% | 95.2 | 87.6 | 89.6 |
| Current Conditions | 104.4 | 108.0 | -0.6% | 105.6 | 97.2 | 97.5 |
| Consumer Expectations | 77.0 | 82.8 | -11.8% | 88.5 | 81.4 | 84.6 |
by Tom Moeller April 29, 2005
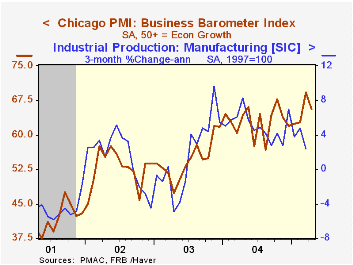
The April Chicago Purchasing Managers Business Barometer gave back more than half of the prior month's 6.5 point jump. Nevertheless, the level of 65.6 was above Consensus expectations for 62.5 and the average level so far this year is up from 2004.
The employment index gave back less than half the prior month's surge. During the last ten years there has been a 78% correlation between the level of the employment index and the three month change in factory sector employment. The new orders and the production indexes fell a bit harder.
The index of prices paid fell again to the lowest level since late 2003. During the last ten years there has been an 86% correlation between the Chicago price index and the three month change in the "core" intermediate goods PPI.
| Chicago Purchasing Managers Index, SA | April | March | April '04 | 2004 | 2003 | 2002 |
|---|---|---|---|---|---|---|
| Business Barometer | 65.6 | 69.2 | 64.2 | 62.9 | 54.6 | 52.8 |
| New Orders | 71.0 | 76.7 | 65.8 | 67.0 | 58.0 | 56.2 |
| Prices Paid | 66.1 | 68.2 | 75.5 | 80.1 | 55.8 | 56.9 |

Tom Moeller
AuthorMore in Author Profile »Prior to joining Haver Analytics in 2000, Mr. Moeller worked as the Economist at Chancellor Capital Management from 1985 to 1999. There, he developed comprehensive economic forecasts and interpreted economic data for equity and fixed income portfolio managers. Also at Chancellor, Mr. Moeller worked as an equity analyst and was responsible for researching and rating companies in the economically sensitive automobile and housing industries for investment in Chancellor’s equity portfolio. Prior to joining Chancellor, Mr. Moeller was an Economist at Citibank from 1979 to 1984. He also analyzed pricing behavior in the metals industry for the Council on Wage and Price Stability in Washington, D.C. In 1999, Mr. Moeller received the award for most accurate forecast from the Forecasters' Club of New York. From 1990 to 1992 he was President of the New York Association for Business Economists. Mr. Moeller earned an M.B.A. in Finance from Fordham University, where he graduated in 1987. He holds a Bachelor of Arts in Economics from George Washington University.
More Economy in Brief


