 Global| Apr 19 2011
U.S. Housing Starts Recover Modestly
by:Tom Moeller
|in:Economy in Brief
Summary
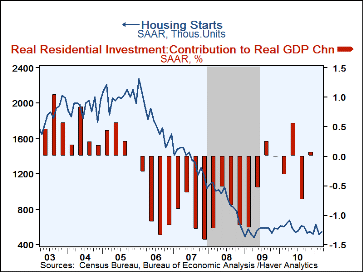
It was a rough winter for the housing sector. The latest indication is the only moderate 7.2% m/m rebound in seasonally-adjusted housing starts last month following a 18.5% February plunge. The rise brought the level to 549,000 (AR) [...]
It was a rough winter for the housing sector. The latest indication is the only moderate 7.2% m/m rebound in seasonally-adjusted housing starts last month following a 18.5% February plunge. The rise brought the level to 549,000 (AR) units from an upwardly-revised 512,000, initially reported as 470,000. The January figure also was revised up slightly. Despite the weather, starts during Q1 managed a 5.4% q/q increase after the 9.2% Q4 decline. Moreover, the rise in March starts outpaced expectations for a gain to 527,000.
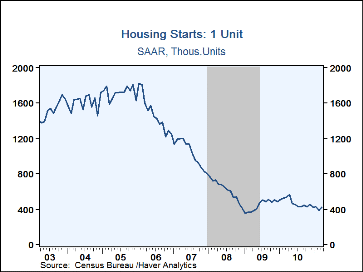
Despite these increments, the latest figures underscore housing's difficulty generating forward momentum. The rise in March starts was paced by a 7.7% gain in single-family activity to 422,000. That mostly recovered a lessened 8.8% February drop, but for the quarter, starts declined 4.8% to the lowest level since the recession trough two years ago. Starts last quarter were notably weak in the Northeast which fell by one-quarter from Q4.
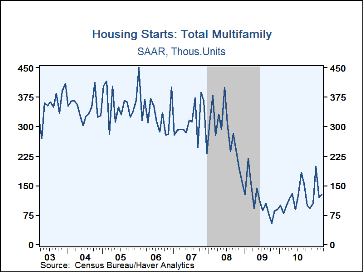
Activity in multi-family starts recently picked up. In March, starts rose 5.8% from February. Coming on the heels of a surge in January, the gain was enough to lift the quarterly average by one-half versus Q4. Starts of 2-4 units building rose moderately but starts of larger buildings with 5-or-more units rose by more than one half.
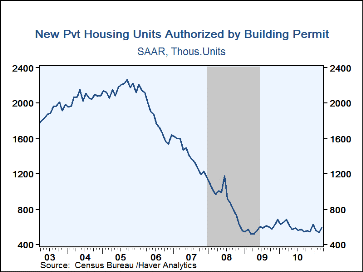
Building permits also recovered 11.2% last month but for the quarter they fell 1.9%. Like starts, weakness in permits last quarter was led by a 4.3% decline in the single-family sector from Q4 versus a 4.8% rise in multi-family.
The housing starts figures can be found in Haver's USECON database. The expectations figure is contained in the AS1REPNA database.
| Housing Starts (000s, SAAR) | Mar | Feb | Jan | Feb Y/Y | 2010 | 2009 | 2008 |
|---|---|---|---|---|---|---|---|
| Total | 549 | 512 | 628 | -13.4 | 585 | 554 | 900 |
| Single-Family | 422 | 392 | 430 | -21.1 | 471 | 442 | 616 |
| Multi-Family | 127 | 120 | 198 | 28.3 | 115 | 112 | 284 |
| Starts By Region | |||||||
| Northeast | 59 | 56 | 92 | -10.6 | 72 | 61 | 120 |
| Midwest | 82 | 62 | 113 | -11.8 | 98 | 95 | 134 |
| South | 297 | 307 | 305 | -12.4 | 296 | 281 | 451 |
| West | 111 | 87 | 118 | -18.4 | 121 | 117 | 195 |
| Building Permits | 594 | 534 | 563 | -13.3 | 595 | 583 | 896 |
Tom Moeller
AuthorMore in Author Profile »Prior to joining Haver Analytics in 2000, Mr. Moeller worked as the Economist at Chancellor Capital Management from 1985 to 1999. There, he developed comprehensive economic forecasts and interpreted economic data for equity and fixed income portfolio managers. Also at Chancellor, Mr. Moeller worked as an equity analyst and was responsible for researching and rating companies in the economically sensitive automobile and housing industries for investment in Chancellor’s equity portfolio. Prior to joining Chancellor, Mr. Moeller was an Economist at Citibank from 1979 to 1984. He also analyzed pricing behavior in the metals industry for the Council on Wage and Price Stability in Washington, D.C. In 1999, Mr. Moeller received the award for most accurate forecast from the Forecasters' Club of New York. From 1990 to 1992 he was President of the New York Association for Business Economists. Mr. Moeller earned an M.B.A. in Finance from Fordham University, where he graduated in 1987. He holds a Bachelor of Arts in Economics from George Washington University.


