 Global| May 19 2009
U.S. Housing Starts' Fall To Record Low Paced By Lower Multi-family Building
by:Tom Moeller
|in:Economy in Brief
Summary
Falling to the lowest level on record during April, total U.S. housing starts were off by more than one-half from one year ago. The Commerce Department reported that total housing starts of 458,000 (AR) were down 12.8% from March [...]
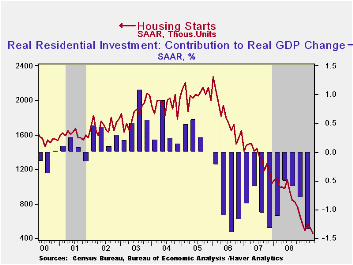
Falling to the lowest level on record during April, total U.S. housing starts were off by more than one-half from one year ago. The Commerce Department reported that total housing starts of 458,000 (AR) were down 12.8% from March after that month's 8.5% decline. Modest revisions to the series extend back to 2007 and the latest figure compares to Consensus expectations for 523,000 starts.
The decline to the record low was led by a 46.1% month-to-month drop in starts of multi-family homes to 90,000. So weak was construction of apartments and condominiums that the decline pulled the level roughly three-quarters below April of last year.
As was the case last month, there is a sign in the latest report that a bottom in the housing market may be forming. Starts of single-family homes increased 2.8% from March after two months of having been unchanged. Regardless, single-family starts remained near the record low for the series which dates back to 1959 and the latest level was down eighty percent since the peak in early-2006. During the last ten years, there has been an 84% correlation between the q/q change in single-family starts and their contribution to quarterly GDP growth.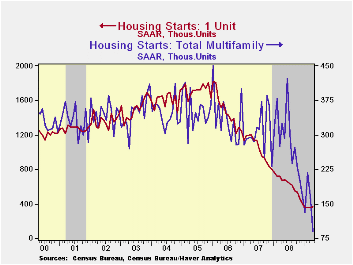
By region, starts of single-family units in the Northeast reversed all of their March rise with a 13.6% (-34.5% y/y) decline. Starts in the Midwest, however, rose to their highest level since November (-36.6% y/y). In the South, single-family starts continued weak. They fell to another record low (-47.6% y/y) but in the West starts jumped 26.6% (-50.6% y/y).
The latest level of building permits also plumbed a new record low last month with a 3.3% decline from March. Overall, permits were down by one-half from last April. Single-family home permits, a leading indicator of starts, however, ticked up 3.6% from March (-42.3% y/y).
The housing starts figures can be found in Haver's USECON database.
U.S. Household Deleveraging and Future Consumption Growth from the Federal Reserve Bank of San Francisco can be found here.
| Housing Starts (000s, SAAR) | April | March | February | Y/Y | 2008 | 2007 | 2006 |
|---|---|---|---|---|---|---|---|
| Total | 458 | 525 | 574 | -54.2% | 900 | 1,342 | 1,812 |
| Single-Family | 368 | 358 | 357 | -45.6 | 616 | 1,036 | 1,474 |
| Multi-Family | 90 | 167 | 217 | -72.3 | 285 | 306 | 338 |
| Building Permits | 494 | 511 | 550 | -50.2 | 895 | 1,392 | 1,844 |

Tom Moeller
AuthorMore in Author Profile »Prior to joining Haver Analytics in 2000, Mr. Moeller worked as the Economist at Chancellor Capital Management from 1985 to 1999. There, he developed comprehensive economic forecasts and interpreted economic data for equity and fixed income portfolio managers. Also at Chancellor, Mr. Moeller worked as an equity analyst and was responsible for researching and rating companies in the economically sensitive automobile and housing industries for investment in Chancellor’s equity portfolio. Prior to joining Chancellor, Mr. Moeller was an Economist at Citibank from 1979 to 1984. He also analyzed pricing behavior in the metals industry for the Council on Wage and Price Stability in Washington, D.C. In 1999, Mr. Moeller received the award for most accurate forecast from the Forecasters' Club of New York. From 1990 to 1992 he was President of the New York Association for Business Economists. Mr. Moeller earned an M.B.A. in Finance from Fordham University, where he graduated in 1987. He holds a Bachelor of Arts in Economics from George Washington University.
More Economy in Brief


