 Global| Jan 22 2009
U.S. Home Builders' Survey At Record Low
by:Tom Moeller
|in:Economy in Brief
Summary
The January Housing Market Index (HMI) from the National Association of Home Builders again reached a record low. At a level of 8 it was more than half below the year-ago figure. The index is compiled from survey questions asking [...]
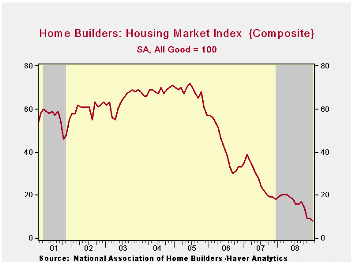
The January Housing Market Index (HMI) from the National
Association of Home Builders again reached a record low. At a level of
8 it was more than half below the year-ago figure. The index is
compiled from survey questions asking builders to rate market
conditions as “good”, “fair”, “poor” or “very high” to “very low”.
Numerical results over 50 indicate a predominance of
“good” readings. 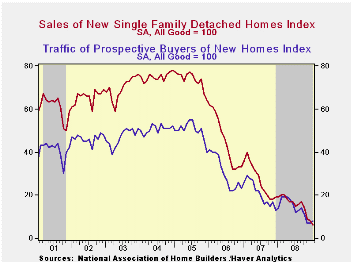
Since 1990, the year-to-year change in this index has had a correlation of 72% with the year-to-year percentage change in new single-family home sales.
The Home Builders Association indicated that its sub-index of present sales conditions also fell to a record low of 6. That was down from last year's average level of 16, 2007's average of 27, 2006's average of 45 and 2005's average of 73.
Builders’ expectations for sales in six months ticked up slightly month-to-month to a level of 17 but that remained down sharply from prior years. The “traffic" of prospective buyers also ticked up slightly from the record low reached in December.
Index readings were mixed last month in the country's regions. In the West the index fell hard month-to-month to a new low. It was down slightly in the Northeast, stable month-to-month in the Midwest and up in the South. Year-to-year, the sharpest decline was in the West.
Not only are builders disturbed by the market for new homes, but the assessment of conditions for remodeling a home also reached a record low during the third quarter. Expectations also fell to a record low.
The NAHB has compiled the Housing Market Index since 1985. The weights assigned to the individual index components are .5920 for single family detached sales, present time; .1358 for single family detached sales, next six months; and .2722 for traffic of prospective buyers. The results, along with other housing and remodeling indexes from NAHB Economics, are included in Haver’s SURVEYS database.
The Yield Curve, January 2009 from the Federal Reserve Bank of Cleveland is available here.
| Nat'l Association of Home Builders | January | December | January '08 | 2008 | 2007 | 2006 |
|---|---|---|---|---|---|---|
| Composite Housing Market Index | 8 | 9 | 19 | 16 | 27 | 42 |

Tom Moeller
AuthorMore in Author Profile »Prior to joining Haver Analytics in 2000, Mr. Moeller worked as the Economist at Chancellor Capital Management from 1985 to 1999. There, he developed comprehensive economic forecasts and interpreted economic data for equity and fixed income portfolio managers. Also at Chancellor, Mr. Moeller worked as an equity analyst and was responsible for researching and rating companies in the economically sensitive automobile and housing industries for investment in Chancellor’s equity portfolio. Prior to joining Chancellor, Mr. Moeller was an Economist at Citibank from 1979 to 1984. He also analyzed pricing behavior in the metals industry for the Council on Wage and Price Stability in Washington, D.C. In 1999, Mr. Moeller received the award for most accurate forecast from the Forecasters' Club of New York. From 1990 to 1992 he was President of the New York Association for Business Economists. Mr. Moeller earned an M.B.A. in Finance from Fordham University, where he graduated in 1987. He holds a Bachelor of Arts in Economics from George Washington University.
More Economy in Brief


