 Global| Apr 01 2026
Charts of the Week: Strait Stress
by:Andrew Cates
|in:Economy in Brief
Summary
Amid tentative signs of de-escalation from the US administration over the past 48 hours—including suggestions that the conflict with Iran could conclude relatively quickly—financial markets have begun to retrace some of last week’s sharp repricing of Middle East risk. Oil prices have come off their highs, while equities and bonds have rallied as risk premia ease. That said, the earlier phase of the week saw a decisive adjustment: oil surged, front-end yields moved higher, and uncertainty rose as investors grappled with the implications of disrupted energy flows. Even now, the overall adjustment has been uneven—volatility has picked up, but not to levels typically associated with sustained geopolitical stress—raising questions about how fully markets are internalising both the risks and the rapidly shifting outlook. Our charts this week capture these cross-currents. Tanker rates have spiked as shipping routes are disrupted and capacity tightens (chart 1), while PMI delivery times point to early signs of supply chain strain feeding into the real economy (chart 2). At the same time, the divergence between elevated policy uncertainty and relatively contained market volatility suggests there could have been a degree of complacency (chart 3). The rise in oil prices is already feeding into higher short-term yields, though this is being tempered by cooling labour markets, anchored inflation expectations and more cautious central bank signalling (charts 4 and 5). Meanwhile, euro area flash CPI has picked up, but core inflation remains relatively benign, suggesting underlying price pressures are still contained for now (chart 6).
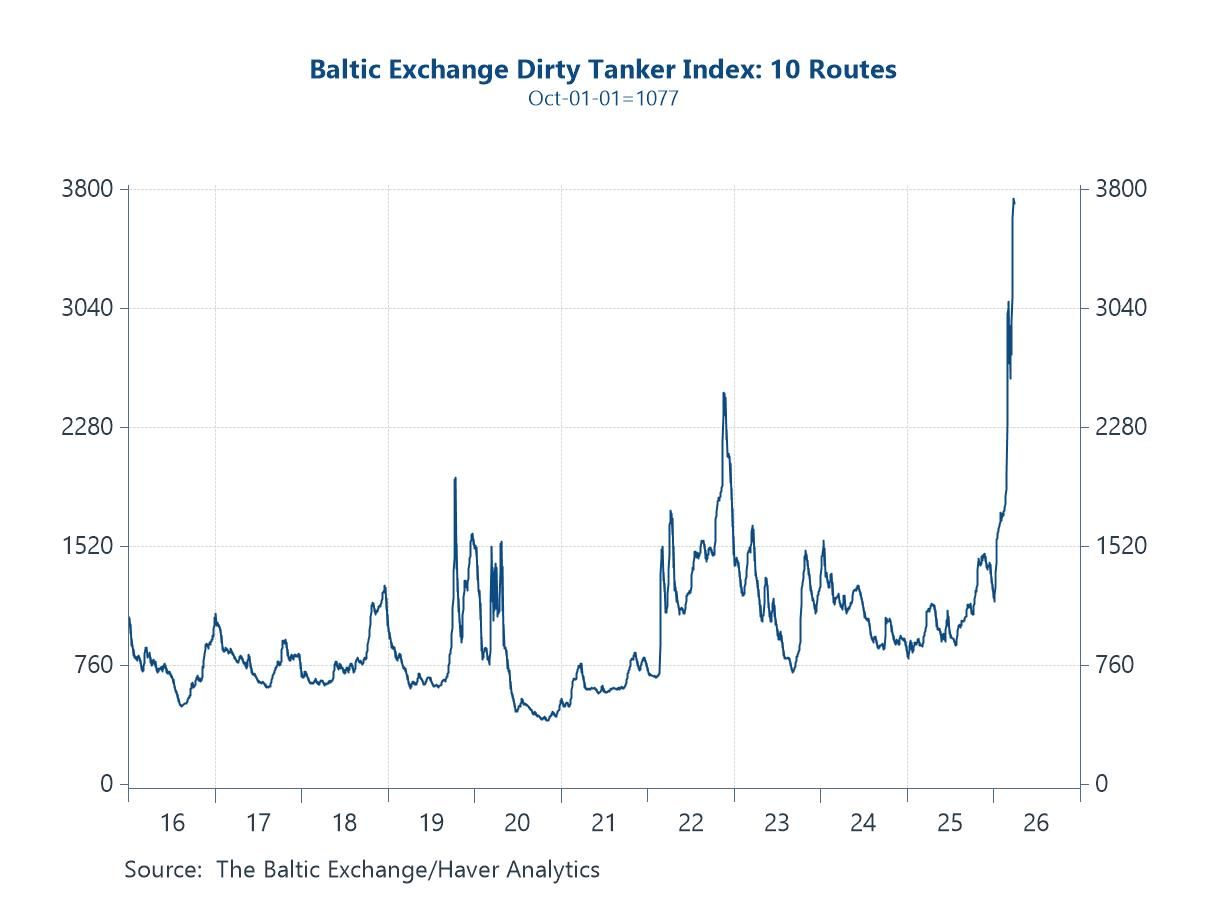
Global shipping costs The Baltic Dirty Tanker Index has surged to multi-year highs, reflecting a sharp tightening in global oil shipping markets. The primary driver is the escalation in Middle East tensions, particularly the effective disruption to flows through the Strait of Hormuz—a critical artery for roughly a fifth of global oil trade. Heightened security risks, including missile and drone attacks on vessels and port infrastructure, have forced rerouting, increased insurance premia and reduced effective tanker supply. At the same time, longer voyage distances—especially for Gulf exports diverted around the Cape—are tying up capacity and amplifying rate pressures. The result is a classic squeeze: constrained supply of available ships meeting elevated demand for transport, pushing freight costs sharply higher.
Chart 1: Baltic Exchange Dirty Tanker Index Suggests Surging Shipping Costs
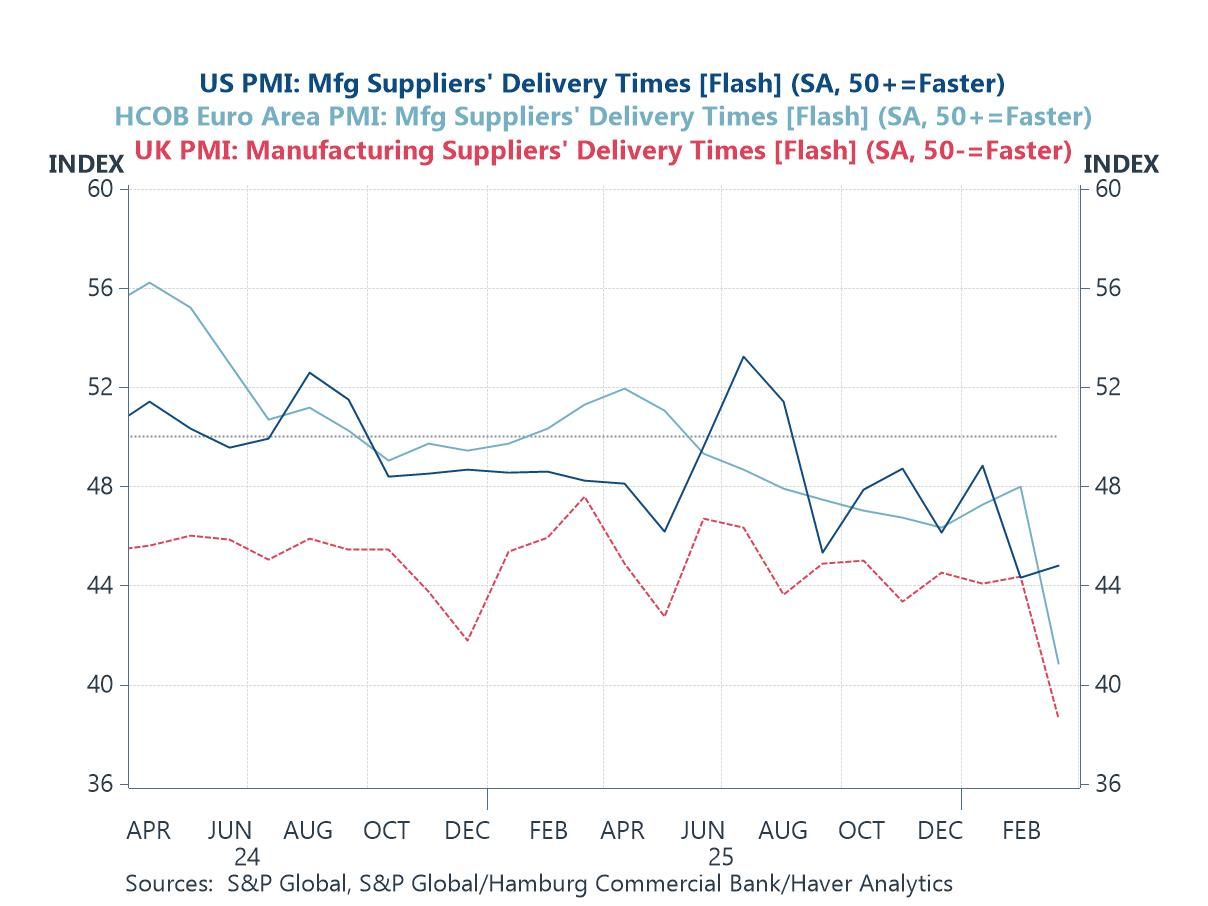
Supply Chain Bottlenecks Flash PMI data point to a renewed build-up of supply chain pressures across the major economies. Supplier delivery times—where readings below 50 indicate slower deliveries—have deteriorated in both the US and UK, with the latter showing a particularly sharp decline. The euro area, while more stable, is also drifting in the same direction. This broad-based softening suggests that the disruptions visible in energy and shipping markets are now feeding into the real economy. Longer delivery times are typically an early indicator of tightening supply conditions, rising input costs and, ultimately, renewed pipeline inflation pressures. While not yet at the extremes seen during the pandemic, the direction of travel is clear: supply chains are becoming less efficient just as geopolitical risks intensify.
Chart 2: Delivery Times Lengthen Across Major Economies
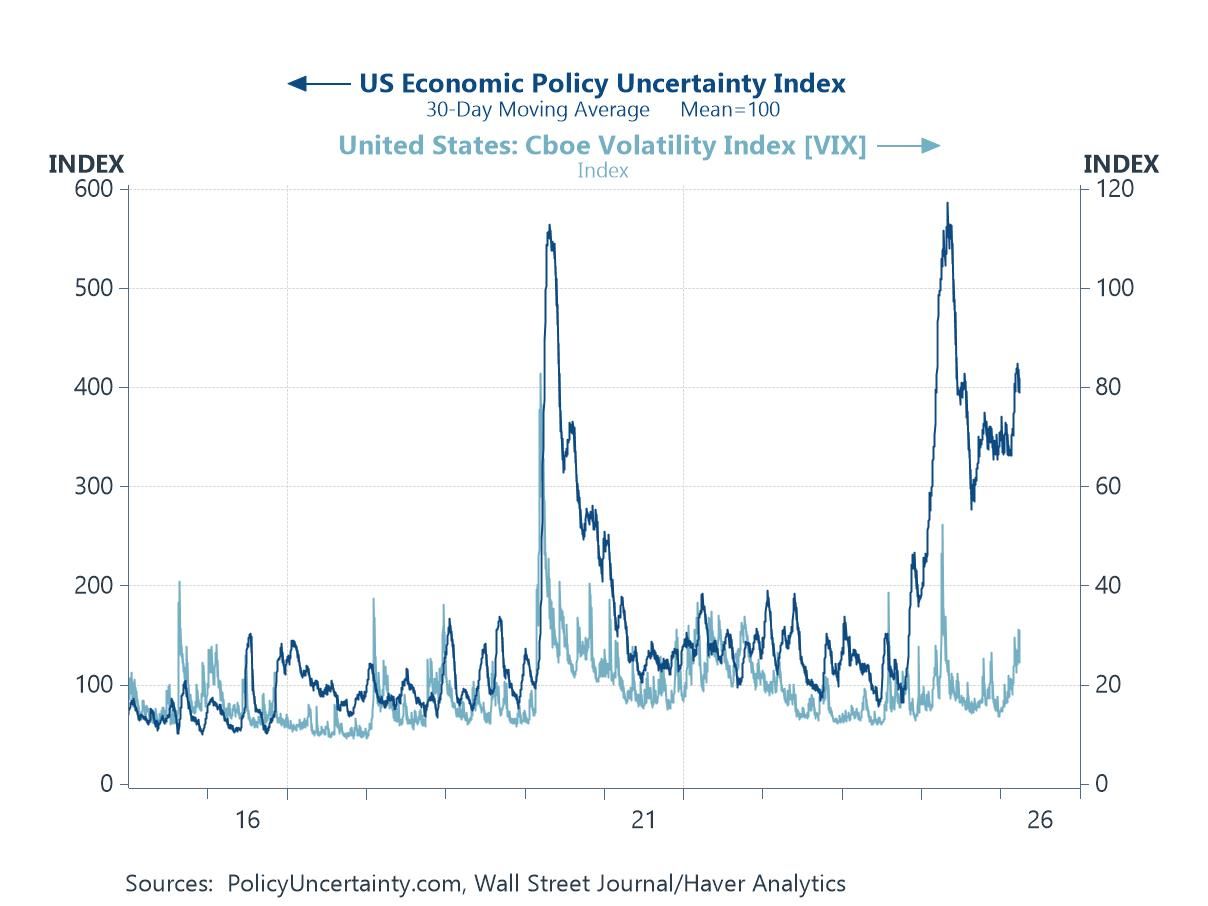
Policy Uncertainty Versus Market Volatility A striking divergence is emerging between policy uncertainty and financial market volatility. The US Economic Policy Uncertainty Index has risen sharply, reflecting the intensifying geopolitical backdrop, trade disruptions and an increasingly complex policy environment. By contrast, the VIX—while off its lows—remains relatively contained by historical standards. This gap suggests that financial markets may be underpricing the scale and persistence of current risks. Either uncertainty begins to recede, or market volatility has further to rise. For now, the message is clear: policymakers are operating in a far more uncertain world than markets appear to be discounting.
Chart 3: Policy Uncertainty Surges While Market Volatility Lags
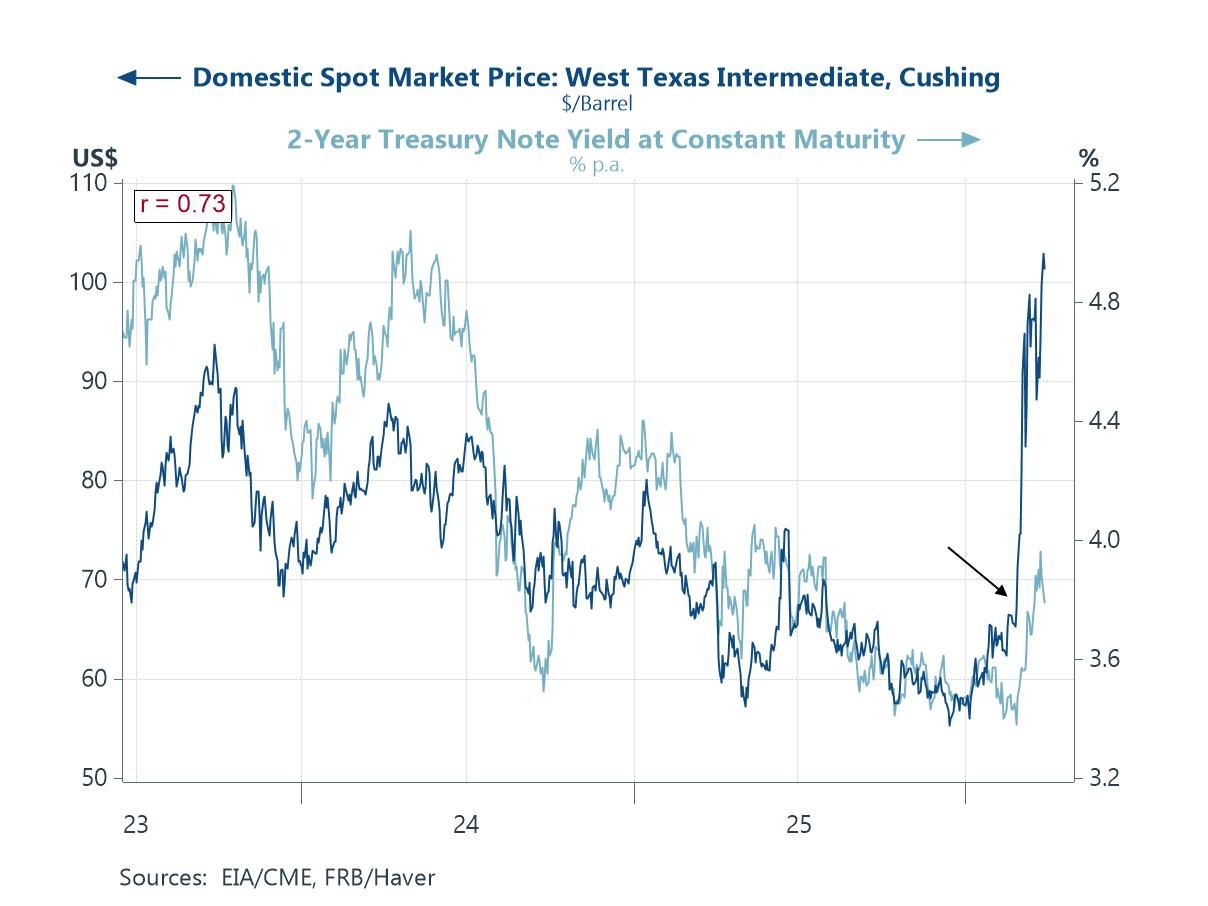
Oil Prices and Monetary Policy The sharp rise in oil prices is once again feeding directly into short-term interest rate expectations, with a strong positive correlation evident between WTI and US 2-year Treasury yields. As energy prices surge, markets are reassessing the near-term inflation outlook and the likely policy response, pushing yields higher. This reflects a familiar dynamic: energy shocks tighten financial conditions not just directly, but via expectations of more restrictive monetary policy. That said, there are important caveats. Medium-term market-based inflation expectations remain relatively well contained, suggesting credibility in central banks’ ability to anchor inflation over time. Moreover, recent communication from Fed Chair Powell indicates that the Federal Reserve is in no immediate hurry to raise rates, pointing instead to a more cautious, data-dependent approach in the face of heightened uncertainty.
Chart 4: Oil Spike Reignites Rate Pressures
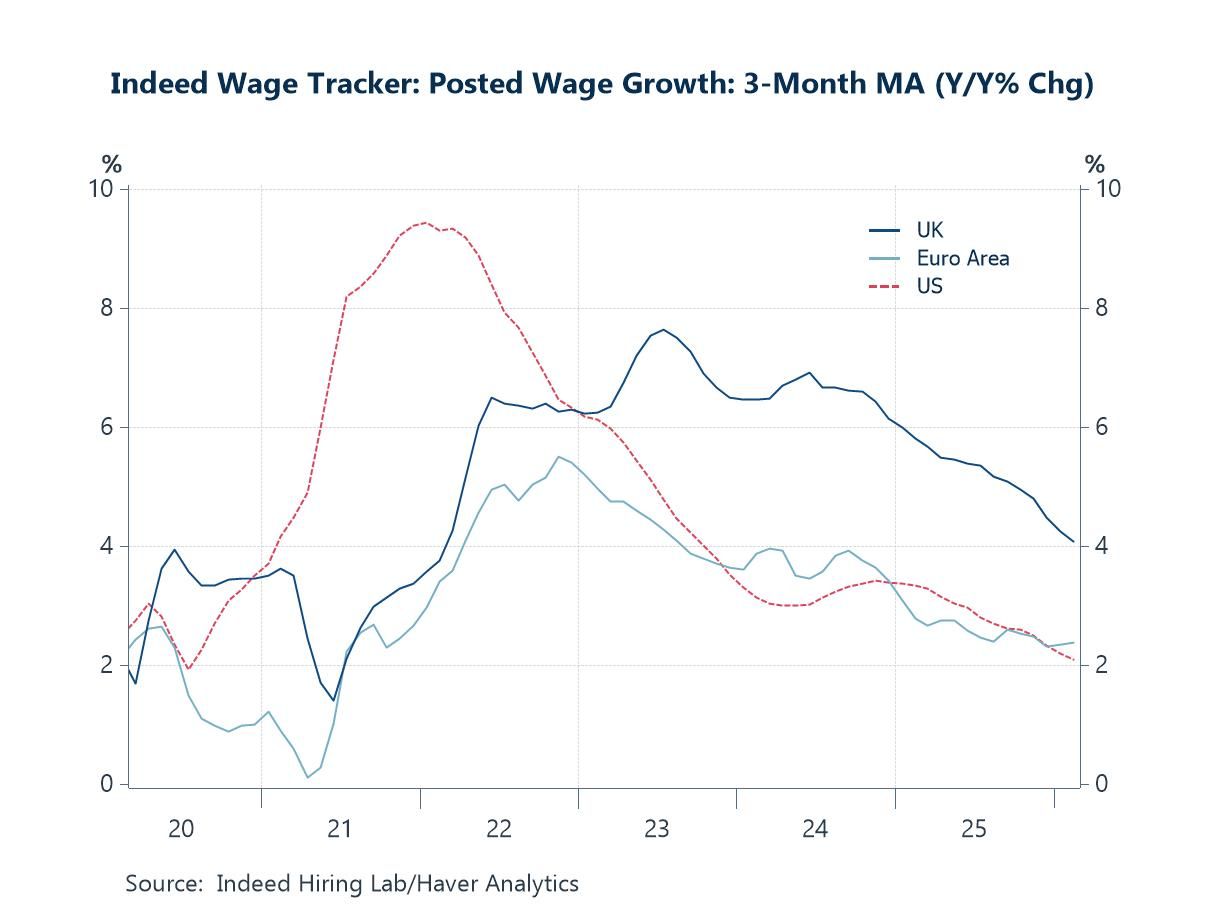
Loose Labour Markets Wage growth across the US, UK and euro area continues to moderate, pointing to a gradual loosening in labour market conditions. The sharp post-pandemic surge in wage pressures—particularly pronounced in the US—has clearly faded, with all three regions now on a downward trajectory. This matters in the current context: while the oil shock is pushing headline inflation higher and complicating the near-term outlook, easing wage dynamics reduce the risk of persistent second-round effects. In turn, this lessens the urgency for central banks to respond aggressively with tighter policy. The result is a more nuanced policy backdrop—one where energy-driven inflation pressures are rising, but underlying domestic cost pressures are moving in the opposite direction.
Chart 5: Wage Pressures Ease Across Major Economies
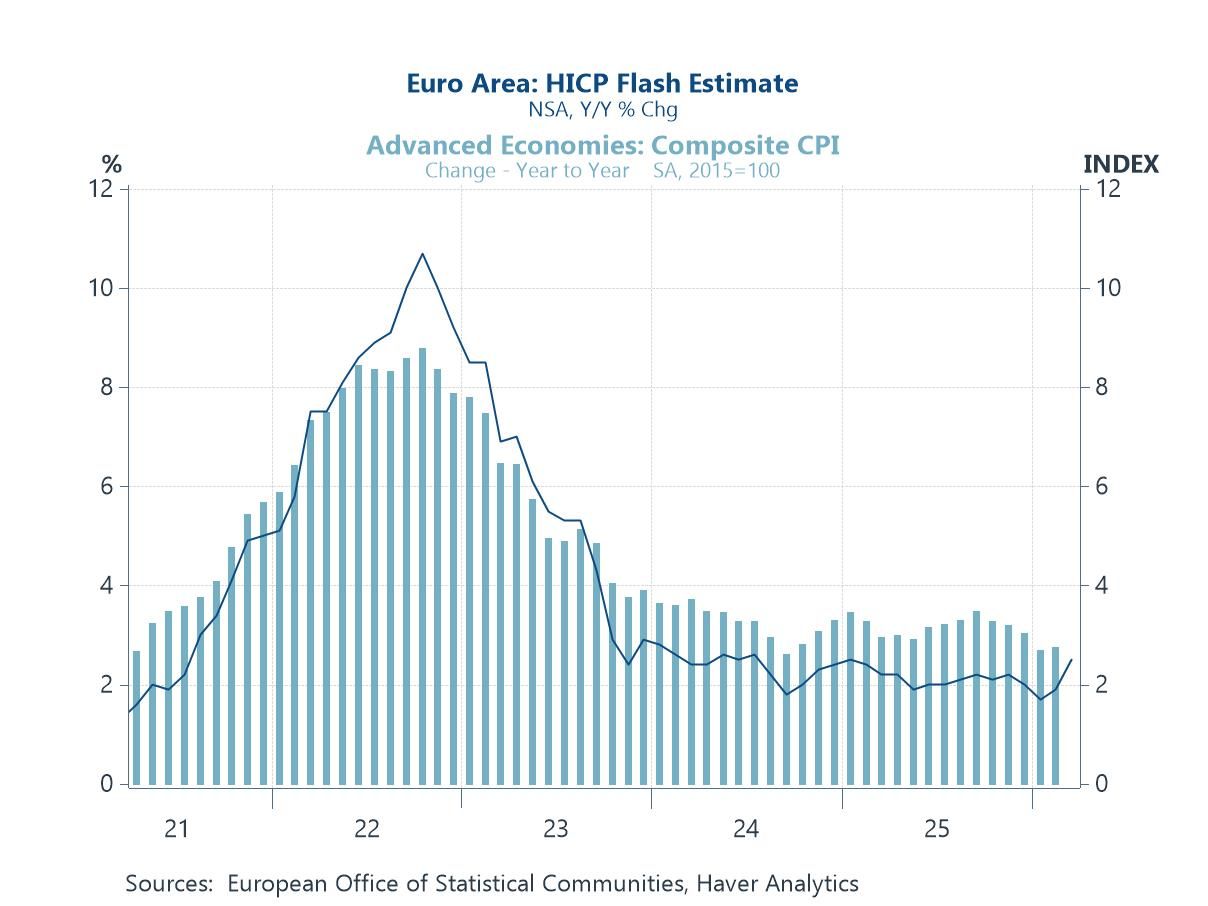
Headline Inflation in Advanced Economies Despite the recent energy shock, broader inflation dynamics across advanced economies remain relatively well behaved. The euro area HICP flash estimate rose from 1.9% in February to 2.5% in March, driven largely by higher energy prices. However, core inflation edged down to 2.3% from 2.4%, suggesting that pass-through into underlying price pressures remains limited for now. More generally, inflation across many advanced economies continues to hover close to central bank targets—a marked contrast to the peaks seen in 2022. While higher oil prices will almost certainly continue to lift headline inflation in the near term, and the risk is clearly tilted toward further upside, the broader picture for now remains one of relatively contained underlying pressures. This suggests the current shock is more likely to complicate the disinflation process—potentially slowing or interrupting it—rather than decisively reversing it, though the balance of risks has become less favourable.
Chart 6: Euro Area Inflation Close to Target

Andrew Cates
AuthorMore in Author Profile »Andy Cates joined Haver Analytics as a Senior Economist in 2020. Andy has more than 25 years of experience forecasting the global economic outlook and in assessing the implications for policy settings and financial markets. He has held various senior positions in London in a number of Investment Banks including as Head of Developed Markets Economics at Nomura and as Chief Eurozone Economist at RBS. These followed a spell of 21 years as Senior International Economist at UBS, 5 of which were spent in Singapore. Prior to his time in financial services Andy was a UK economist at HM Treasury in London holding positions in the domestic forecasting and macroeconomic modelling units. He has a BA in Economics from the University of York and an MSc in Economics and Econometrics from the University of Southampton.
More Economy in Brief


