 Global| May 12 2020
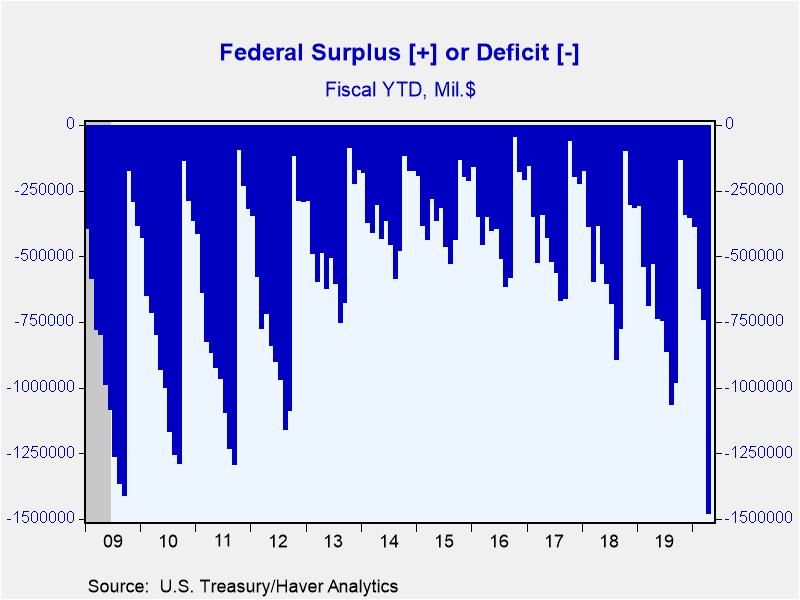
U.S. Government Budget Deficit Jumps to $1.481 Trillion So Far in FY 2020
by:Tom Moeller
|in:Economy in Brief
Summary
• Outlays surge as government begins economic stimulus payments. • Receipts decline as businesses close down and tax payments are delayed. With recession developing, the government's financial situation is deteriorating. The U.S. [...]
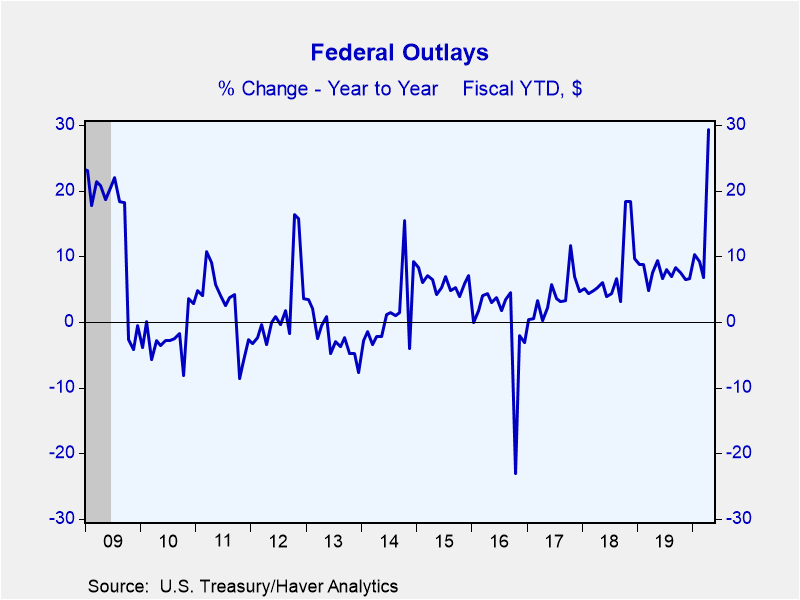
• Outlays surge as government begins economic stimulus payments.
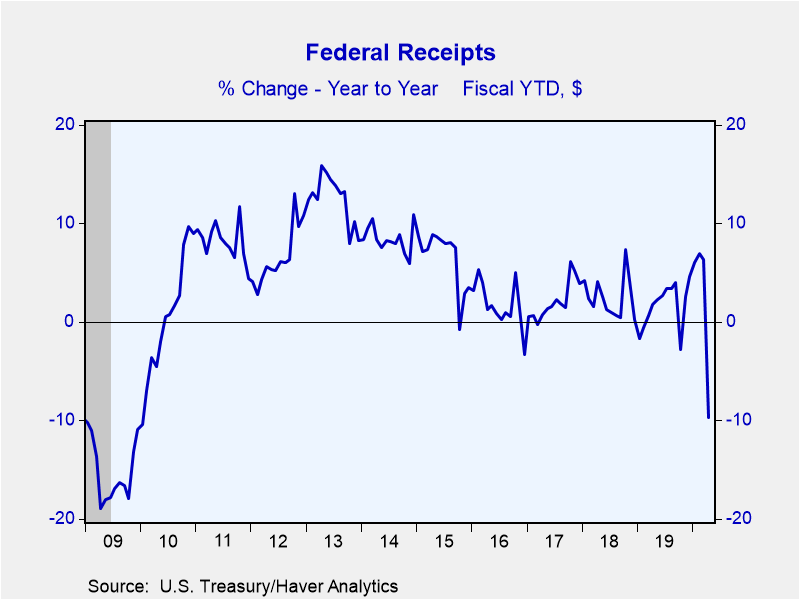
• Receipts decline as businesses close down and tax payments are delayed.
With recession developing, the government's financial situation is deteriorating. The U.S. Treasury Department reported that for the first seven months of FY 2020, the federal government budget deficit soared to $1.481 trillion, nearly three times higher than the $530.87 billion deficit in the first seven months of FY 1999. During April alone, which typically sees a surplus in the budget balance, the federal government ran a record monthly deficit of $737.85 billion. This compares to an April 2019 surplus of $160.30. A $900 billion deficit had been expected in the Action Economics Forecast Survey.
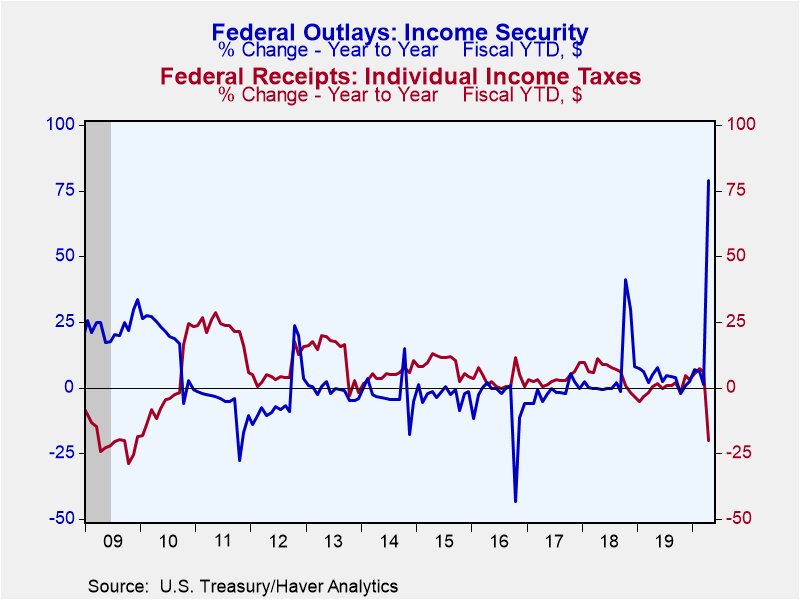
Total federal government outlays have risen 29.3% y/y so far in FY 2020. That increase was led by a 78.8% jump in income security payments as the government rolled out a stimulus package passed by Congress in late March. Medicare outlays surged 32.3% and health outlays increased 19.7% so far this fiscal year with the outbreak of the coronavirus. Outlays on national defense programs grew 6.9% y/y after an 8.8% rise in FY 1999. Spending on Social Security increased a steady 5.2% during the first seven months of FY 2020. Interest payments rose a lessened 3.1% y/y.
So far this fiscal year, federal government receipts declined 9.7% y/y. Personal income tax revenues plummeted 20.1% y/y with higher unemployment and movement of 2019 tax payments to July. Corporate tax receipts declined by 21.7% with reduced business. Social insurance taxes grew a lessened 5.0% y/y this fiscal year. Customs duties, which include tariffs, increased a much slower 8.4% y/y so far this fiscal year with the drop in foreign trade.
Haver's data on Federal Government outlays and receipts as well as CBO forecasts are contained in USECON; detailed data can be found in the GOVFIN database. The Action Economics Forecast Survey numbers are in the AS1REPNA database.
Tom Moeller
AuthorMore in Author Profile »Prior to joining Haver Analytics in 2000, Mr. Moeller worked as the Economist at Chancellor Capital Management from 1985 to 1999. There, he developed comprehensive economic forecasts and interpreted economic data for equity and fixed income portfolio managers. Also at Chancellor, Mr. Moeller worked as an equity analyst and was responsible for researching and rating companies in the economically sensitive automobile and housing industries for investment in Chancellor’s equity portfolio. Prior to joining Chancellor, Mr. Moeller was an Economist at Citibank from 1979 to 1984. He also analyzed pricing behavior in the metals industry for the Council on Wage and Price Stability in Washington, D.C. In 1999, Mr. Moeller received the award for most accurate forecast from the Forecasters' Club of New York. From 1990 to 1992 he was President of the New York Association for Business Economists. Mr. Moeller earned an M.B.A. in Finance from Fordham University, where he graduated in 1987. He holds a Bachelor of Arts in Economics from George Washington University.


