 Global| Feb 28 2019
U.S. GDP Growth Slowed in Q4 but was Stronger than Expected
by:Sandy Batten
|in:Economy in Brief
Summary
Real gross domestic product growth slowed to 2.6% q/q, saar (3.1% y/y) in the fourth quarter of 2018 following a 3.4% q/q increase in Q3 and a 4.2% q/q jump in Q2. The Action Economics Forecast had looked for a 2.3% q/q rise while the [...]
Real gross domestic product growth slowed to 2.6% q/q, saar (3.1% y/y) in the fourth quarter of 2018 following a 3.4% q/q increase in Q3 and a 4.2% q/q jump in Q2. The Action Economics Forecast had looked for a 2.3% q/q rise while the FRB Atlanta GDPNow estimate was a 1.8% q/q increase. This report was delayed by the shutdown of the federal government from late December to late January, and so it was both the advance and the second estimate of Q4 GDP. The BEA emphasized that this estimate “is based on source data that are incomplete and subject to further revision.”
Though quarterly GDP growth slowed in Q4, the annual performances were relatively strong. For the full year 2018, GDP increased 2.9%, the strongest full-year gain since 2005. For the four quarters of 2018, GDP rose 3.1%, also the strongest since 2005.
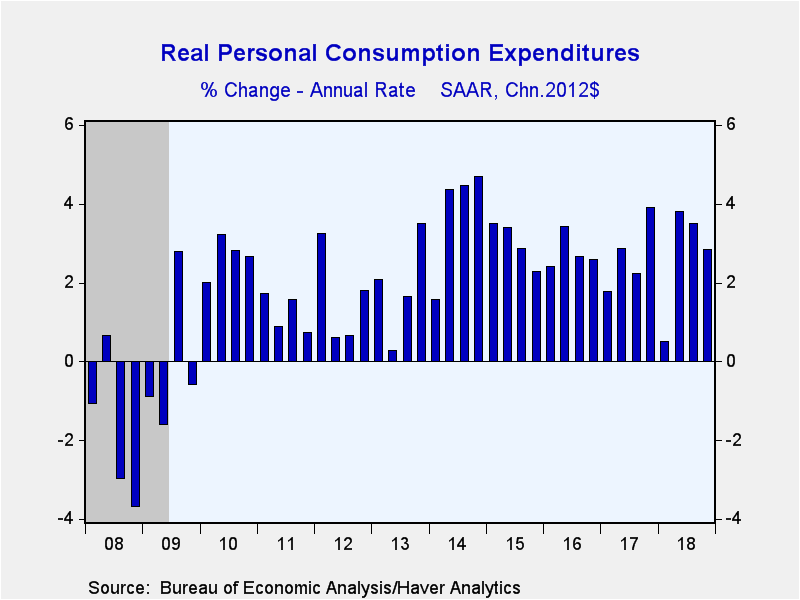
Personal consumption continued to provide the strongest support for overall GDP growth in Q4, though PCE growth slowed markedly (mostly in December). PCE increased 2.8% q/q, saar (2.7% y/y) in Q4, down from 3.5% in Q3 and 3.8% in Q2. It provided 1.9%-pts of the total 2.6% increase in GDP. Spending on durable goods picked up in Q4 (to 5.9% from 3.7% in Q3) while spending on nondurables and services slowed.
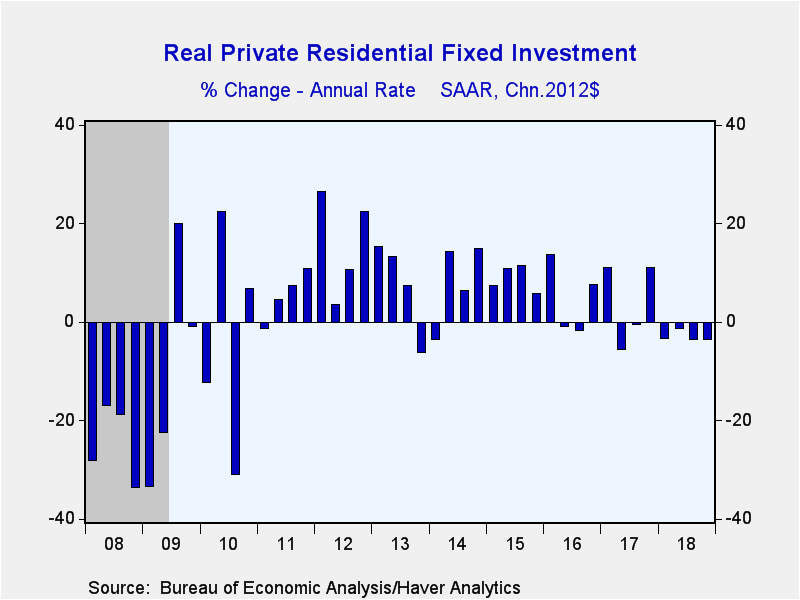
The pace of fixed investment growth picked up in Q4—to 3.9% q/q from 1.1% in Q3. This reflected accelerations in business spending on equipment (6.7% q/q in Q4 vs. 3.4%) and intellectual property (13.1% in Q4 vs. 5.6%). Business spending on structures fell 4.2% q/q in Q4 for the second consecutive quarterly decline. Residential investment continued to a drag on the overall economy. It fell 3.5% q/q in Q4, its fourth consecutive monthly decline. For the four quarters of 2018, residential investment slumped 3.0%.
Inventories provided a small boost to overall GDP growth in Q4, a result that had generally been unexpected until the December wholesale and retail inventory report earlier this week. Business inventories increased $97.1 billion (2012 $) in Q4 on top of an $89.8 billion rise in Q3, thereby adding 0.13%-pt to overall GDP growth after having added a massive 2.33%-pts in Q3. The second consecutive surge in inventory building may not augur well for GDP growth ahead, especially to the extent that this buildup was unintended. However, importers have been accelerating imports (notably from China) ahead of feared U.S. tariff increases, and this may have temporarily expanded inventories. So, the likely normalizing of inventories ahead may not have as large an adverse impact on domestic production as it has in the past.
The net export deficit widened further in Q4 to -$963.2 billion (2012 $) from -$949.7 billion and hence continued to be drag on overall GDP growth. But the trade deficit subtracted only 0.22%-pt from GDP growth in Q4 versus an outsized 1.99%-pt subtraction in Q3. Exports rebounded in Q4, increasing 1.6% q/q after a 4.9% collapse in Q3. Import growth continued at a solid pace, though it slowed considerably from Q3 (2.7% q/q in Q4 vs. 9.3% in Q3).
Abstracting from the impact of inventory building, final sales of domestic product posted a solid 2.5% q/q (2.7% y/y) gain in Q4, up sharply from an anemic 1.0% q/q advance in Q3. And further adjusting for changes in the trade balance, domestic final sales continued to motor along, rising 2.6% q/q (2.9% y/y) in Q4 after a 2.9% q/q rise in Q3.
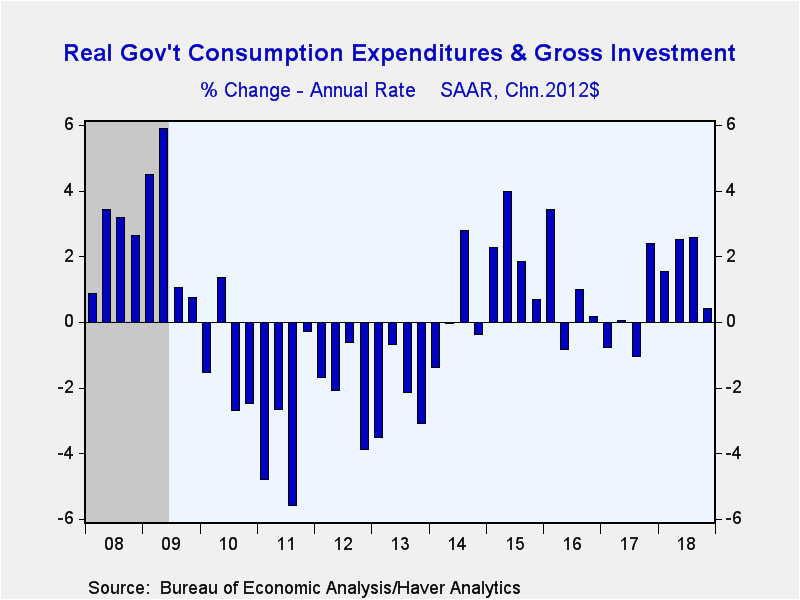
Government spending was essentially flat in Q4 with a 0.4% q/q (1.8% y/y) increase. Federal defense spending rose 6.9% q/q (the largest quarterly increase since 2009) while nondefense spending slumped 5.6% q/q (its largest decline since early 2014), likely restrained in part by the shutdown. State and local government spending edged down 0.3% q/q (its only quarterly decline in 2018).
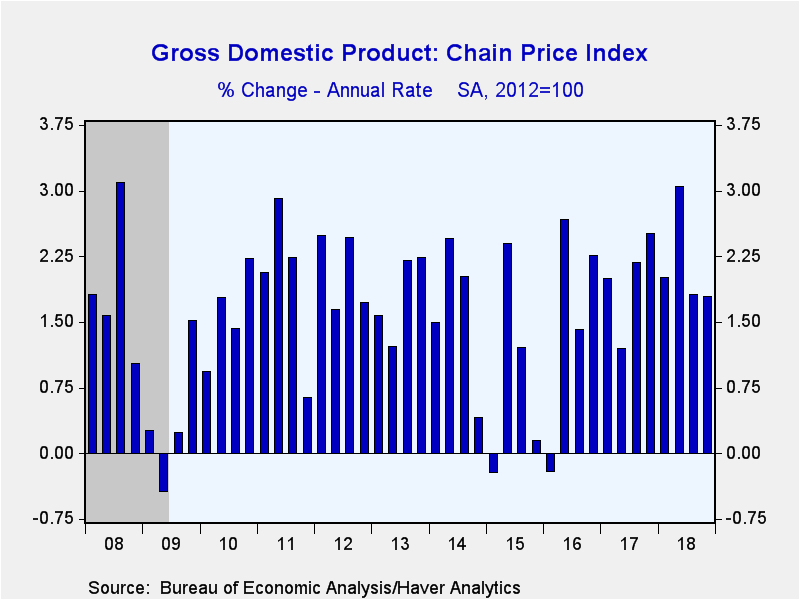
Turning to the inflation figures in the report, the GDP chain price index rose 1.8% q/q, saar (2.2% y/y) in Q4, the same quarterly increase as in Q3. The PCE price index increased 1.5% q/q in Q4, down slightly from the 1.6% q/q advance in Q3, but the core PCE price index (that is, excluding food and energy prices) rose 1.7% q/q (1.9% y/y) in Q4, an unexpected slight step up from the 1.6% q/q gain posted in Q3. At the bottom line, while recent headline inflation readings have been soft, this softness has mostly reflected lower energy prices with core inflation remaining relatively firm.
Income growth picked up in the fourth quarter with nominal personal income up 5.2% q/q, saar from 4.4% in Q3. Moreover, the BEA incorporated benchmark employment and pay data to revise up the Q3 increase. All in all, despite the hit to wealth from the sharp decline in equity prices during the fourth quarter, consumer spending was well supported by strong income growth.
The GDP figures can be found in Haver’s USECON and USNA database. USNA contains virtually all of the Bureau of Economic Analysis’ detail in the national accounts. Both databases include tables of the newly published not seasonally adjusted data. The Action Economics consensus estimates can be found in AS1REPNA.
| Chained 2012 $ (%, AR) | Q4'18 (Advance) | Q3'18 | Q2'18 | Q4'18 Y/Y | 2018 | 2017 | 2016 |
|---|---|---|---|---|---|---|---|
| Gross Domestic Product | 2.6 | 3.4 | 4.2 | 3.1 | 2.9 | 2.2 | 1.6 |
| Inventory Contrib (%-pt) | 0.1 | 2.3 | -1.2 | 0.4 | 0.1 | 0.0 | -0.5 |
| Final Sales | 2.5 | 1.0 | 5.4 | 2.7 | 2.8 | 2.2 | 2.1 |
| Foreign Trade Contrib (%-pt) | -0.2 | -2.0 | 1.2 | -0.2 | -0.2 | -0.3 | -0.3 |
| Domestic Final Sales | 2.6 | 2.9 | 4.0 | 2.9 | 2.9 | 2.5 | 2.3 |
| Personal Consumption Expenditure | 2.8 | 3.5 | 3.8 | 2.7 | 2.6 | 2.5 | 2.7 |
| Nonres Business Fixed Investment | 6.2 | 2.5 | 8.7 | 7.2 | 7.0 | 5.3 | 0.5 |
| Residential Investment | -3.5 | -3.5 | -1.4 | -3.0 | -0.2 | 3.3 | 6.5 |
| Government Spending | 0.4 | 2.6 | 2.5 | 1.8 | 1.5 | -0.1 | 1.4 |
| Chain-Type Price Index | |||||||
| GDP | 1.8 | 1.8 | 3.0 | 2.2 | 2.2 | 1.9 | 1.1 |
| Personal Consumption Expenditure | 1.5 | 1.6 | 2.0 | 1.9 | 2.0 | 1.8 | 1.1 |
| Nonresidential Investment | 1.1 | 1.6 | 2.0 | 1.3 | 1.2 | 0.7 | -0.8 |
| Residential Investment | 3.0 | 3.6 | 7.3 | 5.7 | 5.6 | 4.5 | 3.6 |
Sandy Batten
AuthorMore in Author Profile »Sandy Batten has more than 30 years of experience analyzing industrial economies and financial markets and a wide range of experience across the financial services sector, government, and academia. Before joining Haver Analytics, Sandy was a Vice President and Senior Economist at Citibank; Senior Credit Market Analyst at CDC Investment Management, Managing Director at Bear Stearns, and Executive Director at JPMorgan. In 2008, Sandy was named the most accurate US forecaster by the National Association for Business Economics. He is a member of the New York Forecasters Club, NABE, and the American Economic Association. Prior to his time in the financial services sector, Sandy was a Research Officer at the Federal Reserve Bank of St. Louis, Senior Staff Economist on the President’s Council of Economic Advisors, Deputy Assistant Secretary for Economic Policy at the US Treasury, and Economist at the International Monetary Fund. Sandy has taught economics at St. Louis University, Denison University, and Muskingun College. He has published numerous peer-reviewed articles in a wide range of academic publications. He has a B.A. in economics from the University of Richmond and a M.A. and Ph.D. in economics from The Ohio State University.
More Economy in Brief
 Global| Feb 05 2026
Charts of the Week: Balanced Policy, Resilient Data and AI Narratives
by:Andrew Cates


