Global| Dec 23 2014
U.S. GDP Growth in Q3 Revised Up to Strongest Since 2003; Final Demand Strengthened
by:Tom Moeller
|in:Economy in Brief
Summary
GDP growth last quarter was revised sharply higher to 5.0%, up from last month's estimate of 3.9% growth. The rise was the strongest since Q3 2003. Strengthened growth in final demand accounted for the revision. The gain exceeded the [...]


GDP growth last quarter was revised sharply higher to 5.0%, up from last month's estimate of 3.9% growth. The rise was the strongest since Q3 2003. Strengthened growth in final demand accounted for the revision. The gain exceeded the 4.3% rise in the Action Economics Forecast Survey. So far this year, growth averaged 2.4%, held back by the 2.1% Q1 decline.
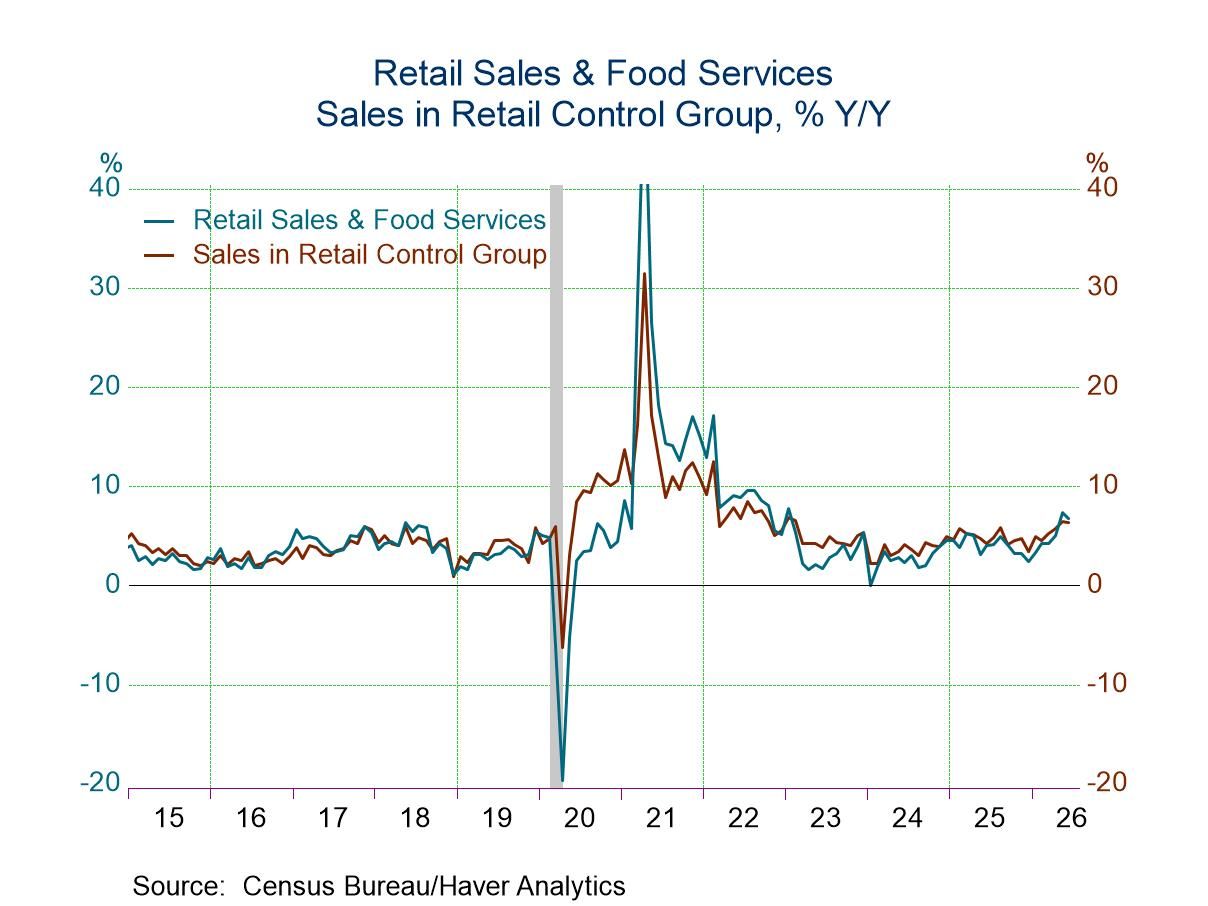
Growth in domestic final demand was raised to 4.1% (2.7% y/y) from 3.2%. Consumer spending grew 3.2% (2.7% y/y), up from the 2.2% estimated earlier. The main source of the revision was a strengthened 2.5% rise (2.1 y/y) in services spending, up from 1.1% estimated last month. Health care spending, up 4.6% (2.8% y/y), accounted for most of the revision. Spending growth on recreation also was raised to 0.7% (-0.5% y/y) instead of declining 3.2%. Durable goods spending growth was increased to 9.2% (8.0% y/y) from 8.7% as motor vehicles purchases improved 11.2% (10.2% y/y), revised from 10.5%. Growth was down, however, from the 19.1% Q2 surge. Furniture & home furnishings spending growth was little-changed at 6.1% (5.9% y/y), though that was roughly half the Q2 increase. Purchases of nondurable goods also was increased to 2.5% (1.8% y/y) from 2.2%. Apparel spending slowed to a little-changed 1.2% rate (1.3% y/y). That compared to 5.6% Q2 growth. Gasoline purchases grew a slight 0.9% (-0.1% y/y) instead of falling marginally.
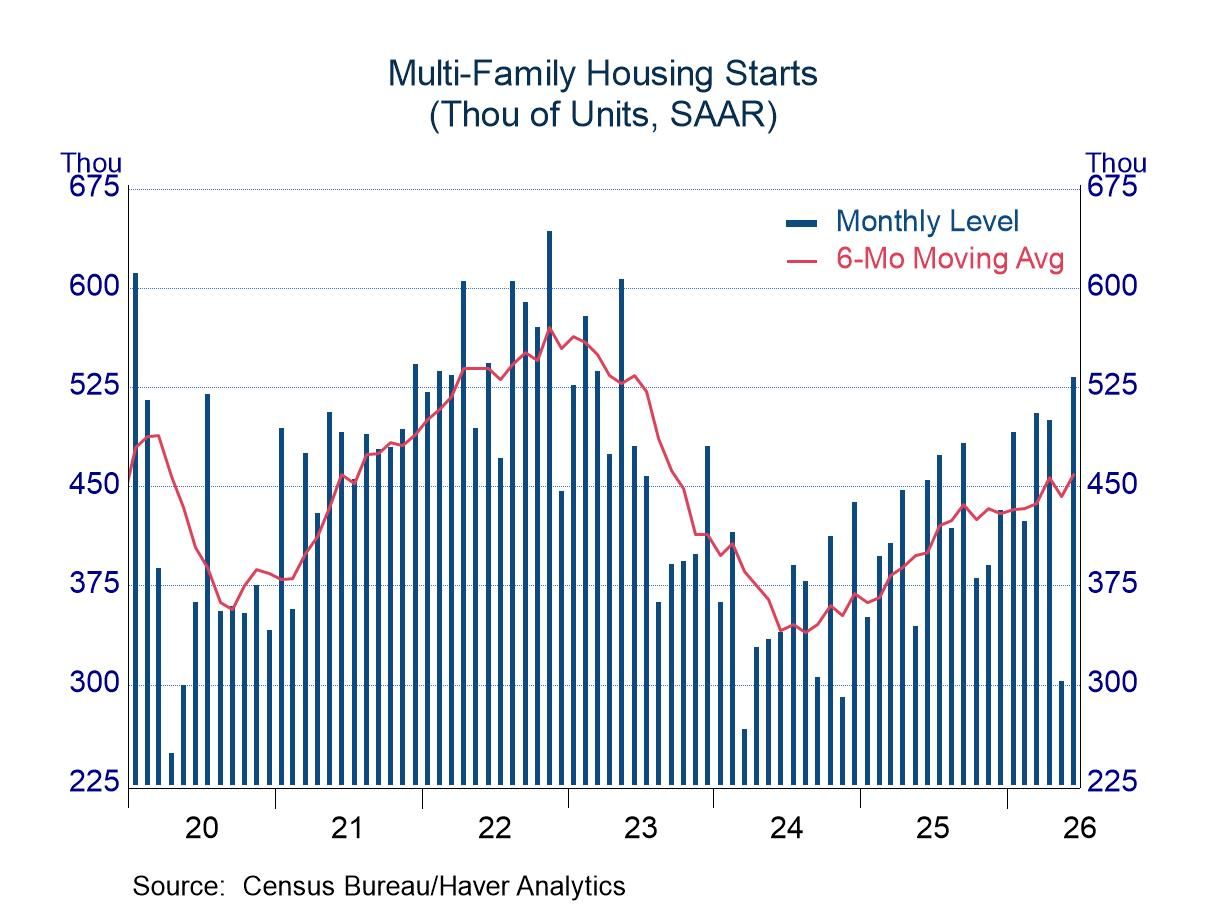
Business investment growth also was strengthened to 8.9% (7.6% y/y) from 7.1%. Investment in intellectual property products gained 8.8% (5.6% y/y), changed from 6.4% estimated earlier. Spending on equipment grew at an improved 11.0% rate (8.7% y/y) led by a one-third rise (17.7% y/y) in transportation equipment. That was offset by a 6.9% decline (+1.0% y/y) in information processing equipment, earlier posted as -7.5%. Structures investment rose 4.8% (8.2% y/y), revised down from 6.4%. Residential investment advanced 3.3% (-0.7% y/y), not 2.7%.


Government spending grew at a 4.4% rate, the quickest since Q2'09. Defense spending firmed at a 16.0% rate (-0.1% y/y), nondefense grew 0.4% (-1.5% y/y) and state & local buying rose at a 1.1% rate (0.9% y/y), these figures were little-changed.
The effect on growth from foreign trade was unrevised at 0.8 percentage points as exports rose 4.6% (3.8% y/y) and imports fell 0.9% (+3.4 y/y). The roughly neutral effect on economic growth from inventories also was little-revised.
Growth in corporate profits after tax was increased to 2.8% (5.1% y/y) from 1.7%. That still was down, however, from the 6.2% gain in Q2. So far this year profits have risen at an 8.2% annual rate after a 4.7% gain last year. Financial sector profits grew 3.6% (-8.2% y/y) and nonfinancial sector earnings rose 2.5% (5.8% y/y). Profits earned from the rest of the world gained a strengthened 4.2% (0.2% y/y).
The GDP price index increased at an unchanged 1.4% annual rate (1.6% y/y). The personal consumption index slowed to 1.2% (1.5% y/y) as durable goods prices fell 2.1% (-2.4% y/y). The service price index rose 1.8% (2.3% y/y), the weakest gain in two years. The nonresidential investment price index rose at a steady 1.1% rate (1.2% y/y) but the residential index jumped 7.2% (6.0% y/y).
The latest GDP figures can be found in Haver's USECON and USNA databases; USNA contains basically all of the Bureau of Economic Analysis' detail in the national accounts, including the integrated economic accounts and the recently added GDP data for U.S. Territories. The Action Economics consensus estimates can be found in AS1REPNA.


| Chained 2009 $, %, AR | Q3'14 (3rd Estimate) | Q3'14 (2nd Estimate) | Q3'14 (Advance Estimate) | Q2'14 | Q1'14 | Q3 Y/Y | 2013 | 2012 | 2011 |
|---|---|---|---|---|---|---|---|---|---|
| Gross Domestic Product | 5.0 | 3.9 | 3.5 | 4.6 | -2.1 | 2.7 | 2.2 | 2.3 | 1.6 |
| Inventory Effect | -0.0 | -0.1 | -0.6 | 1.4 | -1.2 | -0.1 | 0.0 | 0.1 | -0.1 |
| Final Sales | 5.0 | 4.1 | 4.2 | 3.2 | -1.0 | 2.8 | 2.2 | 2.2 | 1.7 |
| Foreign Trade Effect | 0.8 | 0.8 | 1.3 | -0.3 | -1.7 | 0.1 | 0.3 | 0.1 | 0.0 |
| Domestic Final Sales | 4.1 | 3.2 | 2.7 | 3.4 | 0.7 | 2.7 | 1.9 | 2.1 | 1.7 |
| Demand Components | |||||||||
| Personal Consumption Expenditures | 3.2 | 2.2 | 1.8 | 2.5 | 1.2 | 2.7 | 2.4 | 1.8 | 2.3 |
| Business Fixed Investment | 8.9 | 7.1 | 5.5 | 9.7 | 1.6 | 7.6 | 3.0 | 7.2 | 7.7 |
| Residential Investment | 3.3 | 2.7 | 1.9 | 8.8 | -5.3 | -0.7 | 11.9 | 13.5 | 0.5 |
| Government Spending | 4.4 | 4.2 | 4.6 | 1.7 | -0.8 | 0.3 | -2.0 | -1.4 | -3.0 |
| Chain-Type Price Index | |||||||||
| GDP | 1.4 | 1.4 | 1.3 | 2.1 | 1.3 | 1.6 | 1.5 | 1.8 | 2.1 |
| Personal Consumption Expenditures | 1.2 | 1.3 | 1.2 | 2.3 | 1.4 | 1.5 | 1.2 | 1.8 | 2.5 |
| Less Food/Energy | 1.4 | 1.4 | 1.4 | 2.0 | 1.2 | 1.5 | 1.3 | 1.8 | 1.5 |

Tom Moeller
AuthorMore in Author Profile »Prior to joining Haver Analytics in 2000, Mr. Moeller worked as the Economist at Chancellor Capital Management from 1985 to 1999. There, he developed comprehensive economic forecasts and interpreted economic data for equity and fixed income portfolio managers. Also at Chancellor, Mr. Moeller worked as an equity analyst and was responsible for researching and rating companies in the economically sensitive automobile and housing industries for investment in Chancellor’s equity portfolio. Prior to joining Chancellor, Mr. Moeller was an Economist at Citibank from 1979 to 1984. He also analyzed pricing behavior in the metals industry for the Council on Wage and Price Stability in Washington, D.C. In 1999, Mr. Moeller received the award for most accurate forecast from the Forecasters' Club of New York. From 1990 to 1992 he was President of the New York Association for Business Economists. Mr. Moeller earned an M.B.A. in Finance from Fordham University, where he graduated in 1987. He holds a Bachelor of Arts in Economics from George Washington University.
More Economy in Brief