Global| Feb 26 2010
U.S. GDP 4Q Increase Made StrongerBy Inventories
by:Tom Moeller
|in:Economy in Brief
Summary
Rebuilding of depleted inventories was more of a factor behind improvement in 4Q economic than previously estimated. The result brought 4Q real GDP growth up to 5.9% (AR) from the advance estimate of 5.7%. Last quarter's growth was [...]
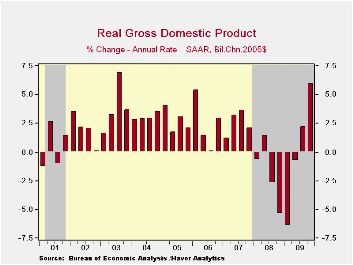
Rebuilding of depleted inventories was more of a factor behind improvement in 4Q economic than previously estimated. The result brought 4Q real GDP growth up to 5.9% (AR) from the advance estimate of 5.7%. Last quarter's growth was the strongest since 3Q 2003 and it raised the y/y change into (slightly) positive territory for the first time since early-2008. The revision slightly exceeded Consensus expectations for 5.7% growth.
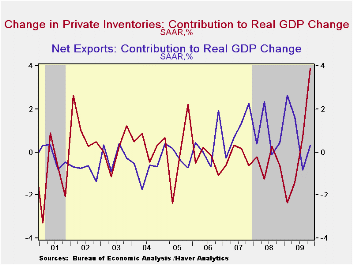
 Voluntary inventory accumulation now is estimated to have
added 3.9 percentage points to economic growth last quarter. It was
necessitated by vigorous and unprecedented decumulation dating back to
2005. Likely prompted by price deflation and poor demand, decumulation
had reduced desired inventory levels too far.
Voluntary inventory accumulation now is estimated to have
added 3.9 percentage points to economic growth last quarter. It was
necessitated by vigorous and unprecedented decumulation dating back to
2005. Likely prompted by price deflation and poor demand, decumulation
had reduced desired inventory levels too far.
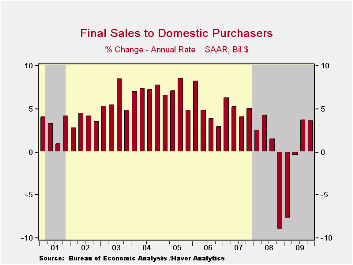
Improvement in the foreign trade deficit contributed slightly less to growth than the previously estimated one-half percentage point. An upwardly revised 22.4% (-0.8% y/y) rise in exports followed a 17.8% 3Q gain as the lower value of the dollar continued to improve the competitiveness of U.S. products. That revision was offset, however, by a larger upward revision to growth in real imports to 15.3% (-6.7% y/y).
Growth in domestic final demand was left roughly unchanged at a moderate 1.6% after a 2.3% 3Q increase. These gains remain the first back-to-back quarterly increases since 2007. Business investment in equipment & software led last quarter's growth with an 18.2% (-7.7% y/y) increase after its 1.5% 3Q rise. Investment in business construction, however, offset much of this increase with a 13.9% decline (-24.3% y/y). Residential investment remained strong with a little-revised 5.0% gain (-12.3% y/y) which was the second consecutive quarterly increase. Personal consumption growth lagged with a downwardly revised 1.7% (1.0% y/y) increase. Finally, quarterly spending by government fell slightly more than initially estimated (+1.3% y/y), mostly due to a drop in defense spending.
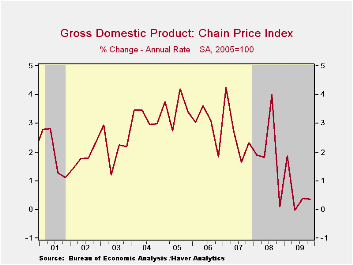
Price inflation was revised slightly downward to a 0.4% gain as measured by the chained GDP price index after little or no inflation during the prior two quarters. Diminished price gains for all of last year pulled the annual increase down to 1.2% which was nearly its weakest increase since the early 1960s. The personal consumption chain price index rose a lessened 2.3% in 4Q and increased just 0.2% for the whole year owing to the yearly decline in energy prices.
The U.S. National Income & Product Account data are available in Haver's USECON and the USNA databases.
| Chained 2005$, % AR | 4Q '09 Preliminary | 4Q '09 Advance | 3Q '09 | 2Q '09 | 4Q Y/Y | 2009 | 2008 | 2007 |
|---|---|---|---|---|---|---|---|---|
| GDP | 5.9 | 5.7 | 2.2 | -0.7 | 0.1 | -2.4 | 0.4 | 2.1 |
| Inventory Effect | 3.9 | 3.4 | 0.7 | -1.4 | 0.1 | -0.7 | -0.4 | -0.4 |
| Final Sales | 1.9 | 2.2 | 1.5 | 0.7 | -0.0 | -1.7 | 0.8 | 2.5 |
| Foreign Trade Effect | 0.3 | 0.5 | -0.8 | 1.7 | 0.9 | 1.0 | -1.2 | 0.8 |
| Domestic Final Demand | 1.6 | 1.7 | 2.3 | -0.9 | -0.9 | -2.7 | -0.4 | 1.7 |
| Chained GDP Price Index | 0.4 | 0.6 | 0.4 | -0.0 | 0.7 | 1.2 | 2.1 | 2.9 |
by Tom Moeller
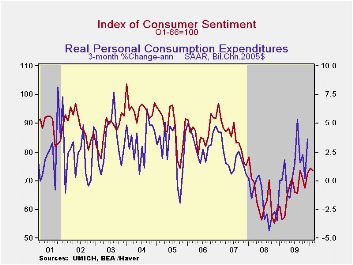
Contrary to yesterday's troubling report of lower consumer confidence, the Reuters/University of Michigan Index of Consumer Sentiment for February fell just slightly to 73.6. The figure remained near its two-year high of 74.4 reached last month and was little different from the mid-month report. The latest figure fell just short of Consensus expectations for 74.0 though it compares favorably to the low of 55.3 in November 2008. During the last ten years there has been a 61% correlation between the level of sentiment and the three-month change real consumer spending.
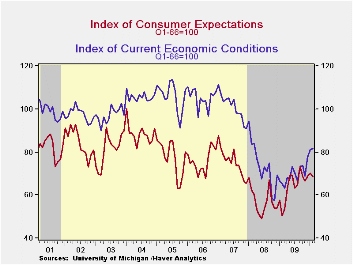 Expected economic conditions accounted for the m/m decline
with a lessened 2.4% m/m drop to the lowest level since November.
Expectations for business conditions during the next year and during
the next five years fell moderately but expectations for personal
finances fell to the lowest level in twelve months.
Expected economic conditions accounted for the m/m decline
with a lessened 2.4% m/m drop to the lowest level since November.
Expectations for business conditions during the next year and during
the next five years fell moderately but expectations for personal
finances fell to the lowest level in twelve months.
Sentiment about current economic conditions increased a lessened 0.9% but that still was to the highest level since March 2008. Assessments of current financial conditions were unchanged m/m at their highest since September of 2008. Buying conditions for large household goods, including furniture, refrigerators, stoves & televisions, moved up another 2.3% to the highest level since January 2008 but the view of current personal finances slipped (+15.4% y/y) following two months of strength.
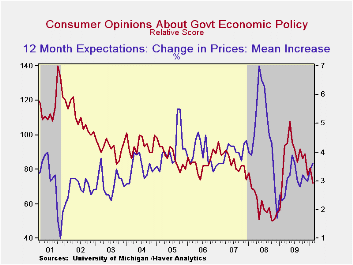
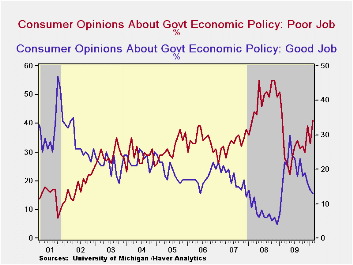
Expected price inflation during the next year was firmer than indicated earlier at 3.6% and was up from the December 2008 reading of 1.7%.Respondents' view of government policy, which may eventually influence economic expectations, fell to its lowest level in twelve months. Just thirteen percent of respondents thought that a good job was being done by government versus 41% who thought a poor job was being done, a twelve-month high.
The Reuters/University of Michigan survey data are not seasonally adjusted. The reading is based on telephone interviews with about 500 households at month-end. These results are based on about 320 interviews. The summary indexes are in Haver's USECON database with details in the proprietary UMSCA database.
| University of Michigan | Final - February | Mid-February | January | December | Feb. y/y | 2009 | 2008 | 2007 |
|---|---|---|---|---|---|---|---|---|
| Consumer Sentiment | 73.6 | 73.7 | 74.4 | 72.5 | 30.7% | 66.3 | 63.8 | 85.6 |
| Current Conditions | 81.8 | 84.1 | 81.1 | 78.0 | 24.9 | 69.6 | 73.7 | 101.2 |
| Expectations | 68.4 | 66.9 | 70.1 | 68.9 | 35.4 | 64.1 | 57.3 | 75.6 |
by Tom Moeller February 26, 2010
 The
National
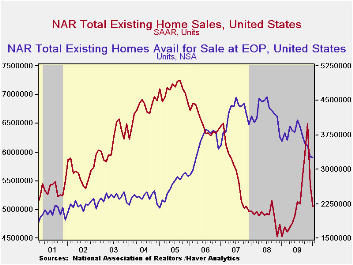
Association of Realtors reported that January sales of
existing homes fell another 7.2% to 5.050M units (SAAR) after
a little-revised 16.2% December decline. The decline may have been
again influenced by the timing of a recently-extended home-buyer tax
credit. The fall in January home sales greatly exceeded Consensus
expectations for a decline to 5.90M.
The
National
Association of Realtors reported that January sales of
existing homes fell another 7.2% to 5.050M units (SAAR) after
a little-revised 16.2% December decline. The decline may have been
again influenced by the timing of a recently-extended home-buyer tax
credit. The fall in January home sales greatly exceeded Consensus
expectations for a decline to 5.90M.
The home-buyer tax credit of up to $8,000 now runs though April 30. Additionally, a new credit of up to $6,500 is available to some existing home owners who move. The full details of the home-buyer tax credit can be found here.
Sales of single-family homes fell 6.9% but they remained up
8.6% y/y as
home affordability improved with lower prices and low interest rates.
Sales 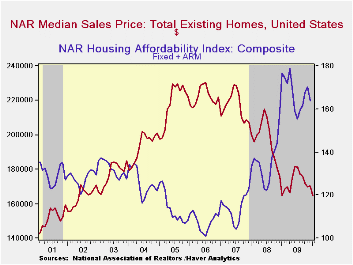 of condos and co-ops alone fell 8.1% from December to 620,000 but
were up by one-third from twelve months ago.
of condos and co-ops alone fell 8.1% from December to 620,000 but
were up by one-third from twelve months ago.
The median price of all existing homes fell 3.4% last month after a much-reduced 0.3% December rise. The latest level equaled that of 12 months ago and these were the lowest since May 2002. Some comfort may be taken from the unchanged level of prices versus one year ago versus the 2.4%-to-12.4% declines during the last three years. These declines have raised the affordability of a home to near its record high although the rate of increase has slowed sharply.
The number of unsold homes (single-family & co-ops) fell 0.5% in January (-9.6% y/y) to the lowest level since March 2006. At the current sales rate there was a slightly-increased 7.8 months' supply of homes on the market, near the lowest since late 2006. The latest figure was down from a high of 11.3 months during April of 2008. For single-family homes, the inventory rose to a 7.6 months' supply.
The data on existing home sales, prices and affordability can be found in Haver's USECON database. The regional price, affordability and inventory data is available in the REALTOR database.
| Existing Home Sales (Thous, SAAR) | January | December | November | Y/Y | 2009 | 2008 | 2007 |
|---|---|---|---|---|---|---|---|
| Total | 5,050 | 5,440 | 6,590 | 11.5% | 5,160 | 4,893 | 5,675 |
| Northeast | 820 | 920 | 1,150 | -22.4 | 863 | 847 | 1,009 |
| Midwest | 1,080 | 1,160 | 1,540 | 8.0 | 1,166 | 1,125 | 1,329 |
| South | 1,870 | 2,020 | 2,380 | -12.0 | 1,913 | 1,858 | 2,244 |
| West | 1,280 | 1,350 | 1,420 | 7.6 | 1,216 | 1,063 | 1,093 |
| Single-Family | 4,430 | 4,760 | 5,710 | 8.6 | 4,567 | 4,338 | 4,959 |
| Median Price, Total, $ (NSA) | 164,700 | 170,500 | 170,000 | 0.0 | 172,742 | 197,233 | 216,633 |
by Robert Brusca February 26, 2010
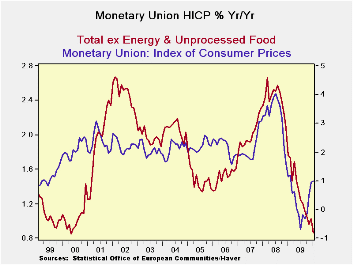
The EMU HICP has finalized for January. Headline prices fell and core prices ( ex energy and unprocessed food) fell by 0.3%. Core prices continue to drive their Yr/Yr rate lower to juts under 1%. Goods prices in the Zone are up by 0.7% Yr/Yr while service prices are up 1.4%.over three months goods prices are falling.
EMU inflation among the large countries is fairly tightly clustered. German inflation is 0.7% over 12-months and marks the low while Italy at 1.3% over 12-months marks the high. The UK, a non monetary union country, but an EU member has headline inflation at 3.5% for 12-months.
Core inflation is clustered in the Union as well. Spain at 0.3% has the lowest Core rate over twelve months. Germany and France are both at 0.9%. Italy at 1.5% has the highest core rate.
Over three and six months headline inflation in the Zone is well-behaved while UK inflation continues to bulge, running up by as much as a 6.2% at an annual rate over three months.
In the Zone core inflation is universally low over three months; the large country with the lowest core inflation rate is Germany at -0.7%, over six months Italy has the high at 1.9%
Inflation in the Zone is weak and economic activity has been weakening. Weather has been severe in the US in Europe and it has hit the UK hard in a few places. It is hard to know the role of weather in blunting the forces of growth. For now central banks can take some breathing room on the inflation front. Growth however has yet to turn the corner in a strong dependable way.
| Trends in HICP | |||||||
|---|---|---|---|---|---|---|---|
| % mo/mo | Saar | ||||||
| Jan-10 | Dec-09 | Nov-09 | 3-Mo | 6-Mo | 12-Mo | Yr Ago | |
| EMU | -0.1% | 0.2% | 0.2% | 1.4% | 2.2% | 1.0% | 1.1% |
| Core | -0.3% | 0.1% | 0.0% | -0.4% | 0.4% | 0.9% | 1.8% |
| Goods | -0.9% | -0.1% | 0.4% | -2.4% | 1.4% | 0.7% | 0.2% |
| Services | -0.5% | 0.8% | -0.2% | 0.3% | -0.7% | 1.4% | 2.4% |
| HICP | |||||||
| Germany | 0.1% | 0.1% | 0.2% | 1.5% | 1.7% | 0.7% | 0.9% |
| France | 0.2% | 0.3% | 0.2% | 2.5% | 2.5% | 1.2% | 0.8% |
| Italy | -0.3% | 0.3% | 0.2% | 0.7% | 2.0% | 1.3% | 1.5% |
| UK | 0.9% | 0.4% | 0.3% | 6.2% | 4.4% | 3.5% | 3.0% |
| Spain | 0.0% | 0.2% | 0.5% | 2.7% | 2.4% | 1.1% | 0.8% |
| Core:xFE&A | |||||||
| Germany | -0.3% | 0.2% | -0.1% | -0.7% | 0.2% | 0.9% | 1.2% |
| France | -0.2% | 0.2% | 0.0% | 0.1% | 0.3% | 0.9% | 1.6% |
| Italy | -0.5% | 0.3% | 0.2% | 0.0% | 1.9% | 1.5% | 2.1% |
| UK | #N/A | 0.2% | 0.2% | #N/A | #N/A | #N/A | 1.8% |
| Spain | -0.3% | 0.1% | 0.1% | -0.1% | 0.0% | 0.3% | 1.9% |

Tom Moeller
AuthorMore in Author Profile »Prior to joining Haver Analytics in 2000, Mr. Moeller worked as the Economist at Chancellor Capital Management from 1985 to 1999. There, he developed comprehensive economic forecasts and interpreted economic data for equity and fixed income portfolio managers. Also at Chancellor, Mr. Moeller worked as an equity analyst and was responsible for researching and rating companies in the economically sensitive automobile and housing industries for investment in Chancellor’s equity portfolio. Prior to joining Chancellor, Mr. Moeller was an Economist at Citibank from 1979 to 1984. He also analyzed pricing behavior in the metals industry for the Council on Wage and Price Stability in Washington, D.C. In 1999, Mr. Moeller received the award for most accurate forecast from the Forecasters' Club of New York. From 1990 to 1992 he was President of the New York Association for Business Economists. Mr. Moeller earned an M.B.A. in Finance from Fordham University, where he graduated in 1987. He holds a Bachelor of Arts in Economics from George Washington University.
More Economy in Brief